Model data for Shigella flexneri (2a, strain 2457T) in the human
| Dose |
Illness |
Not illness |
Total |
| 180 |
9 |
27 |
36 |
| 5000 |
28 |
21 |
49 |
| 1E+04 |
1 |
3 |
4 |
| 1E+04 |
52 |
36 |
88 |
| 1E+05 |
3 |
1 |
4 |
| 1E+05 |
14 |
10 |
24 |
| 1E+06 |
7 |
1 |
8 |
| 1E+07 |
13 |
6 |
19 |
| 1E+08 |
7 |
1 |
8 |
|
Goodness of fit and model selection
| Model |
Deviance |
Δ |
Degrees
of freedom |
χ20.95,1
p-value |
χ20.95,m-k
p-value |
| Exponential |
677 |
671 |
8 |
3.84
0 |
15.5
0 |
| Beta Poisson |
6.04 |
7 |
14.1
0.535 |
| Beta-Poisson fits better than exponential; cannot reject good fit for beta-Poisson. |
|
Optimized parameters for the beta-Poisson model, from 10000 bootstrap iterations
| Parameter |
MLE estimate |
Percentiles |
| 0.5% |
2.5% |
5% |
95% |
97.5% |
99.5% |
| α |
1.17E-01 |
4.86E-02 |
6.43E-02 |
7.25E-02 |
1.68E-01 |
1.78E-01 |
2.02E-01 |
| N50 |
3.64E+03 |
3.32E+02 |
8.92E+02 |
1.22E+03 |
9.16E+03 |
1.12E+04 |
1.73E+04 |
|
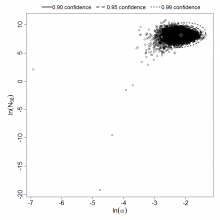
Parameter scatter plot for beta Poisson model ellipses signify the 0.9, 0.95 and 0.99 confidence of the parameters.
beta Poisson model plot, with confidence bounds around optimized model