Team members: Herman, M. R., Kiulia, N., Kermis, A., Aldawood, M., Aceituno, A., Sadik, N.
Problem Statement
Introduction
Noroviruses are single stranded RNA non-enveloped viruses that belong to the family Caliciviridae (King et al. and Green). This virus is classified into five genogroups (G) on the basis of sequence similarity of the capsid protein and of these groups, NoV GI, NoV GII and NoV GIV infect humans (King). Globally NoVs are the major cause of gastroenteritis in all age groups and are responsible for at least 50% of all gastroenteritis outbreaks (Hall et al.). The Human NoVs are the most frequently implicated etiological agents of sporadic cases and community outbreaks of nonbacterial gastroenteritis associated with the consumption of fecal contaminated water sources, food produce and shellfish (Patel). Over the last decade several studies on NoV outbreaks around the globe have demonstrated the importance of NoV as a major public health concern, according to Matthews and Tran, and have prompted additional research to investigate strain prevalence (Patel and Vega et al.) and the emergence of new strains (Fu, Kiulia, Mans, Mwenda, & Taylor, and Lu et al.).
Quantitative risk assessment has been highly recommended by the 2012 European Food Safety Authority (EFSA) to evaluate the potential risks of human NoV illness associated with the consumption of oysters. Quantitative microbial risk assessment (QMRA) is emerging as an important discipline for addressing complex food safety problems. This approach combines existing laboratory and surveillance databases with computational techniques to yield models that predict public health outcomes. To understand more about the transmission of NoV, a quantitative risk assessment was conducted.
Problem Formulation
Between 1994 and 2008 oysters were responsible for NoV outbreaks in various locations across the globe including the UK (Baker et al.), Australia (Brake), the US (Alfano-Sobsey) and Canada (David). Using previous outbreak data and published literature on oyster-pathogen interactions, prevalence and persistence of NoV in surface waters, and outbreaks of NoV-associated gastroenteritis, a QMRA was carried out to model the impact of NoV associated gastroenteritis as a result of consumption of fecally contaminated oysters/shellfish.
The model was developed to answer the following two questions:
1. What is the risk of illness to healthy, susceptible adults caused by oysters contaminated with NoV from a point source sewage contamination in a river?
2. Are coliphage levels an appropriate indicator of gastrointestinal illness caused by NoV contaminated oysters caused by point source sewage in a river?
Hazard Identification
Transmission
NoVs are transmitted mainly through the fecal-oral route. In most cases direct person-to-person spread and food and water that are fecally contaminated have been implicated in NoV-associated outbreaks of gastroenteritis, according to Mathijs et al.. In many cases, food is a frequent vehicle for virus transmission (Huang et al.), especially among raw shellfish such as oysters. The typical infectious dose is between 18 and 1000 viral particles (Teunis et al.) followed by an incubation period of approximately 10 to 51 hours (Glass, Parashar, & Estes) or 24 to 48 hours (Wall, Dymond, Bell, & Thornley). Most infected persons shed viruses in the stool prior to the onset of symptoms (Teunis et al.) and peak fecal virus shedding may even occur more than two weeks after symptoms have resolved, according to Atmar and Estes. Infected symptomatic humans can shed up to 109 NoV genomic copies/g feces as measured by quantitative reverse transcriptase polymerase chain reaction (qRT-PCR), according to Atmar et al.. NoV can also be shed asymptomatically by infected hosts for over 35 days, according to Leon et al..
Norovirus genotype
Through molecular genotyping nine G1 genotypes and 22 GII genotypes have been reported worldwide, according to Kroneman et al.. Research has demonstrated that strain prevalence is often dependent on transmission route and environmental conditions, according to Bitler et al.. Oyster-associated NoV outbreaks have been caused by both G1 and G11 genotypes (Bitler et al., Gallimore et al., and Wang and Deng), thus for this QMRA, differentiation amongst NoV strains was not considered.
Norovirus in Oysters
Norovirus outbreaks associated with oyster consumption are well documented globally in the UK (Baker et al.), Australia (Brake), the US (Alfano-Sobsey) and Canada (David). NoVis particularly concerning in oysters due to the ability of oysters to bioaccumulate pathogens in its gastrointestinal tract and the persistence of NoV in the environment, according to Burkhardt and Westrell et al.. Following bioaccumulation with contaminated waters, NoVs have been detected in shellfish 8-10 weeks (Greening, Lake, & Hudson) after contamination and in oysters 4 weeks after contamination, according to Nappier, Graczyk, & Schwab. Although laboratory studies suggest that cooking shellfish meats up to 90°C (194ºF) for 1.5 min may effectively inactivate NoVs (European Commission), outbreaks related to undercooked oysters continue to be a public health risk, according to Alfano-Sobsey.
Illness Characterization
In the United States, about 19-21 million NoV-attributed illnesses and 800 deaths are estimated to occur annually (Kambhampati, Koopmans, & Lopman), and the average person can have NoV illness many times in their life due to the regular emergence of strain variants limiting population immunity. The most common symptoms of NoV are watery diarrhea, vomiting, nausea, stomach pain, anorexia, and fever, which can lead to more severe, fatal symptoms in highly susceptible populations such as young children and the elderly, according to the CDC. The NoV associated outbreaks are usually characterized by high attack rates in all ages.
Exposure Assessment
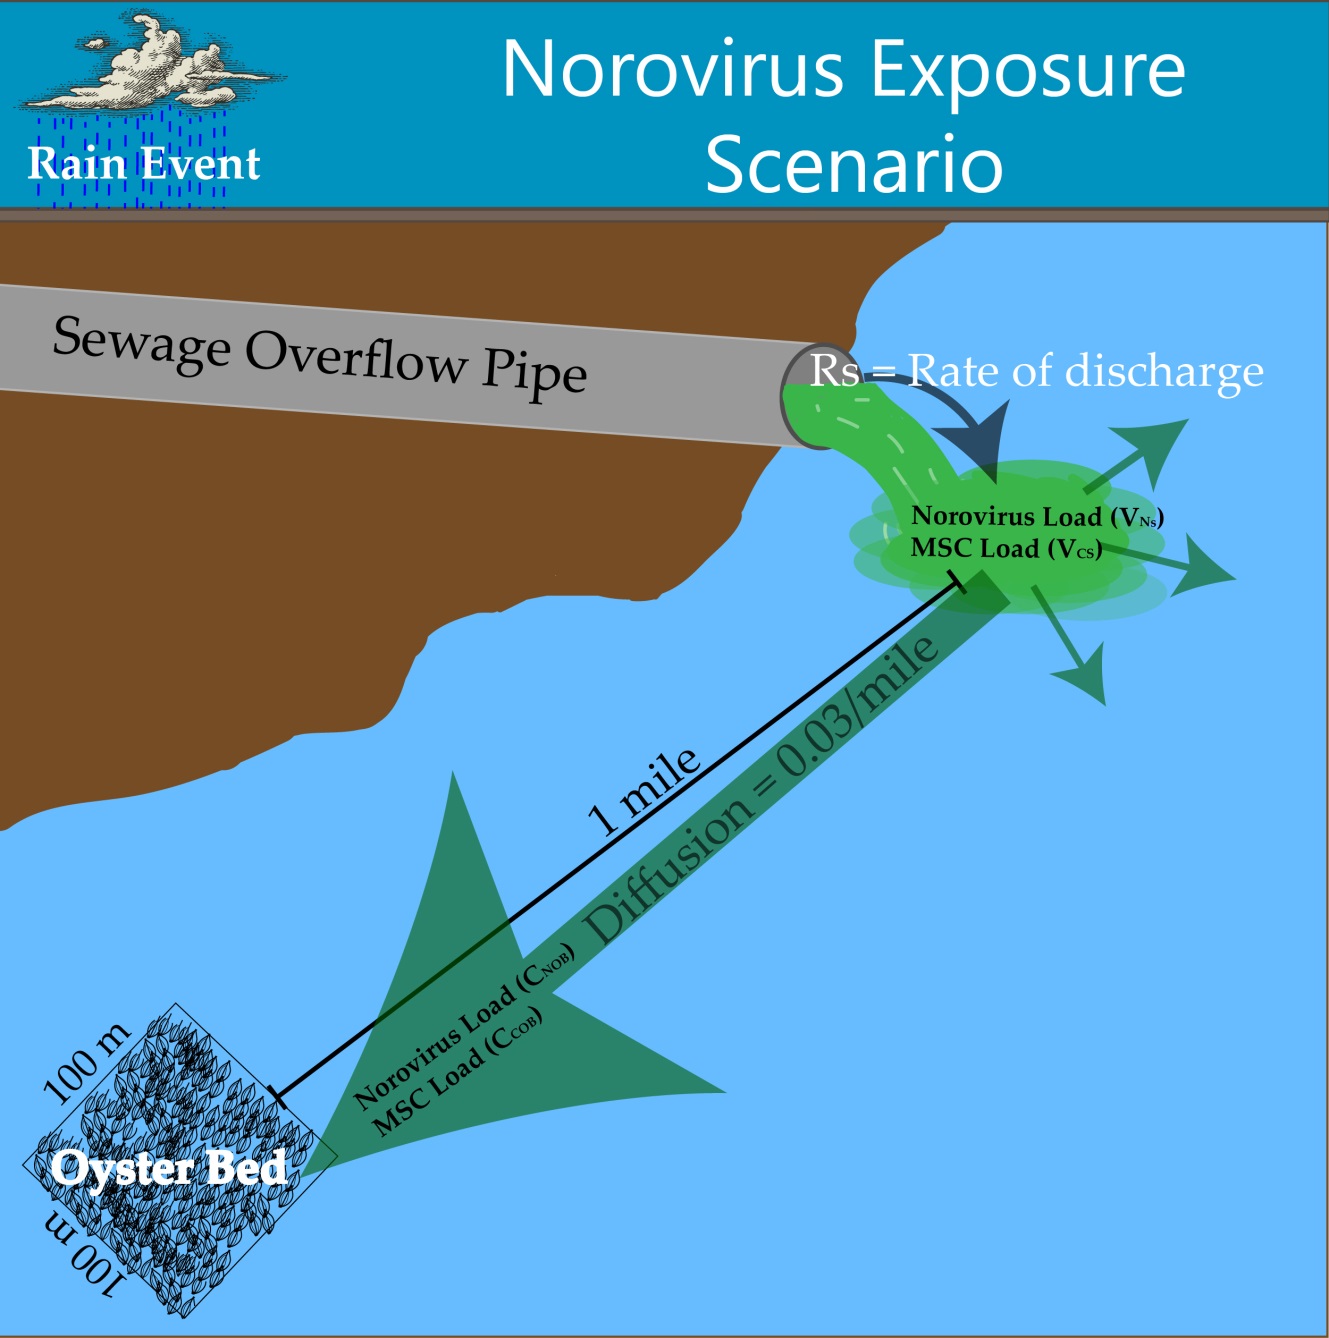
The exposure route considered for this risk assessment was defined as the risk of exposure via consumption of oysters following a sewage overflow event in the Rappahannock River in Virginia.
Figure 1. Exposure Scenario Model
The exposure pathway begins with sewage entering the Rappahannock River at a constant flow rate (200 L/hr) over a period of five hours. A previous sewage event in the Rappahannock River from 2011 was used as a reference for sewage overflow volume, according to Theis. Concentrations of NoV and coliphage in sewage were found in literature, according to Baggi, Demarta, & Peduzzi, Montazeri et al., Myrmel, Lange, & Rimstad, and Pouillot et al.. Upon entry into the river, the sewage plume exhibits plug flow as it is transported downstream one mile to an oyster harvesting bed. From the entry point to the oyster harvesting bed, the concentration of NoV and coliphage in the river water was assumed to be diluted 20-100 fold over a uniform distribution.
The oyster harvesting bed in this exposure scenario has dimensions of 100m x 100m x 5m and an oyster density of 20-168 oysters per square meter, according to Luckenbach, Coen, Ross, & Stephen. The oysters in the harvesting bed are in contact with the sewage contaminated water for the duration of the spill, after which the NoV and coliphage concentrations in the water are reduced to zero in accordance with the previously mentioned plug flow assumption. The oysters are assumed to be filtering the contaminated water and bioaccumulating pathogens while in contact with the contaminated water. Oysters are filter-feeders and have an internal mechanism that allows for the straining of water for nutrients and food particles. During the filtration process, oysters bioaccumulate microorganisms in their gastrointestinal tract which is the primary risk to oyster consumers. Filtration and presence-absence bioaccumulation studies suggest that there is variation in filtration and therefore bioaccumulation among different oyster species, different pathogen species, and different environmental conditions. Currently there is no available data on bioaccumulation kinetics for any oyster species to our knowledge, thus a simplified approach was used.
Once the sewage plume has moved downstream of the harvesting bed, the oysters continue filtering river water and expelling NoV and coliphage from the GI tract until harvesting. The expulsion of NoV was modeled using depuration kinetics for hepatitis A (HAV) (Polo, Feal, & Romalde) and the expulsion of coliphage was modeled using depuration kinetics for MS2, according to Love, Lovelace, & Sobsey. A range of 10-18% of oysters in the harvesting bed were considered ready for consumption at any given time, according to Luckenbach, Coen, Ross, & Stephen. Each oyster was assumed to contain the same level of contamination of NoV and coliphage, and each serving size was assumed to contain 12 oysters, according to Praveen et al.. From harvesting to consumption, it was assumed that the contamination levels stay constant in the oysters and are not affected by food handlers. Therefore, each consumer eats 12 oysters contaminated with uniform levels of NoV and coliphage in each oyster, resulting in the final exposure dose per person.
Dose Response
Dose-response data for NoV is very sparse due to the fact that NoV cannot be propagated in culture. Nevertheless, several dose-response models have been developed with the data available, according to Atmar et al., Teunis et al., and Thebault et al.. For the scope of this QMRA, the beta-binomial model developed by McBride et al. based on the beta-Poisson model presented by Teunis et al., was used to evaluate the risk of infection and illness within the community. Several assumptions were presented by McBride et al. to validate the model: (1) only one individual is “exposed” per exposure event; (2) the individual represents all individuals exposed and thus is an “average individual” that can describe the impact of the risk for an entire population; and finally (3) there is no Poisson distribution associated with the dose each individual receives. This allowed the risk of infection to be represented by the following equation:
\begin{align*} R = \frac{n_{si}+(n_{si} \times r_{mss}) + (n_{ai} \times r_{mas})}{n_p} \end{align*}
(1)
Where and are the beta-Poisson variables identified by Teunis et al. and i is the dose of NoV to which the individual is exposed. However, it was noted that at low doses (i.e. <0.4 genomic copies/dose) this model becomes unrealistic, indicating that the risk of infection is greater than the level of genomes present. Therefore, for doses <0.4 a linear relationship between the actual dose and risk of infection was used.
Methods of Risk Management Evaluation
In order to evaluate uncertainty in the model, we will use Spearman’s Rank Correlation to determine which parameters contribute most to model uncertainty,
One limitation to evaluating the risk using this model is that there is no established acceptable risk of NoV illness to the consumer or the population when contaminated shellfish is consumed (“model population risk”), and thus there is no acceptable risk threshold with which to compare the model output.
Our model calculates the risk to the population when shellfish from a harvest area that has been recently reopened after an emergency area closure due to a sewage stormwater overflow of raw sewage into the harvest waters. The U.S. national shellfish sanitation program (NSSP) Guide for the Control of Molluscan Shellfish recommends that a harvest area may be reopened after such an event if a) it has been 7 days since contamination has ceased, AND b) male-specific Coliphage (MSC) levels are below 50 MSC per 100 grams of shellfish, according to the U.S. Food and Drug Administrationcd .
In order to evaluate how the model population risk is affected by the aforementioned NSSP Shellfish guideline, we will compare risks during different two different sewage overflow scenarios and three, stricter, alternative guidelines:
We will compare the model population risk under conditions that meet the NSSP Guide for re-opened harvest areas with the risk when alternative criteria are met:
1. Increasing the minimum wait period before harvest to 15 days, no change to MSC maximum acceptable levels.
2. Increasing the minimum wait period before harvest to 30 days, no change to MSC maximum acceptable levels.
3. No change to minimum wait period; halving the MSC maximum levels to 25 MSC per 100 grams of shellfish (3.25 PFU/oyster in our model using the assumption of 13 g average oyster size).
Risk Characterization
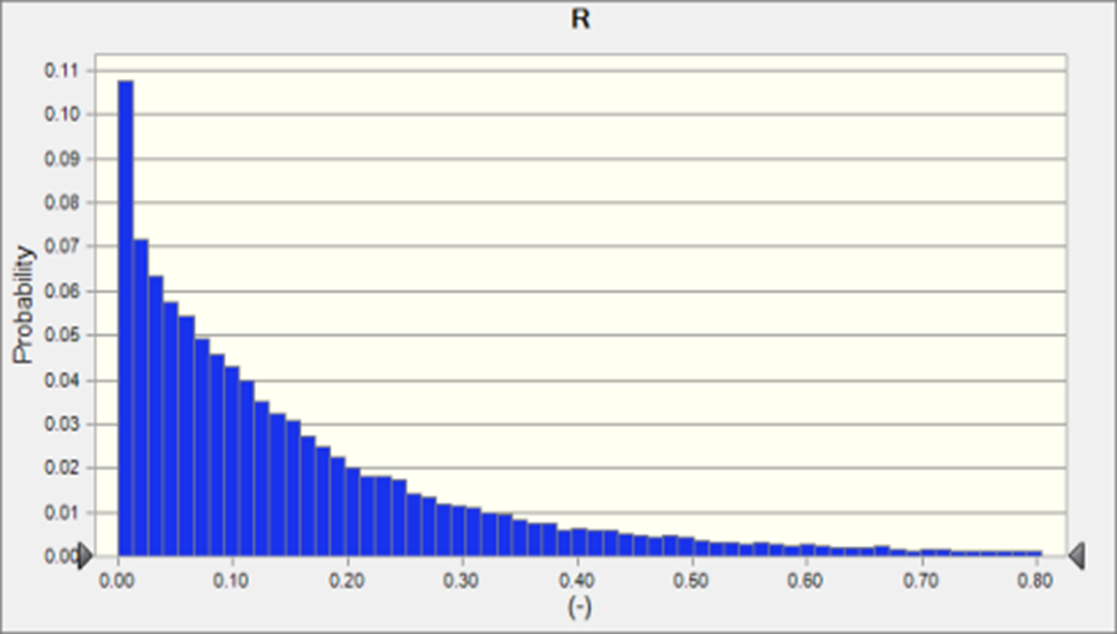
For the small overflow scenario (5 hours overflow event from combined sewer), after following NSSP guidelines for reopening the oyster bed to harvest, contamination levels of NoV (mean 0.07 + 0.11 GC/oyster), and MSC (mean 0.63 + 0.47 PFU/oyster ) were quite low - below the cutoff for keeping the bed closed in most cases, and likely below the limits of detection for both NoV or MSC methods (Fig. 2a). Regardless of the low levels of the exposure pathogen, because of the high infectivity of NoV and the wide range of reproduction rates for NoV in the literature, the risk of infection was quite high, 18,000 in a population of 100,000 (Fig. 1a) The spike at R=0 represents the MonteCarlo scenario runs where MSC levels in oysters were high enough to merit keeping the bed closed to harvest.
For the large overflow scenario (30 hours overflow event from combined sewer) resulted in much higher contamination levels of NoV (mean 2.5 + 3.9 GC/oyster), and MSC (mean 3.8 + 2.8 PFU/oyster) (Fig. 2b). The resulting risk to the population was higher (0.24 + 0.29) than the 5 hr scenario, but not as high as would have been expected with a 6-fold higher pathogen overflow event. This is because there were many scenarios in which the oyster bed remained closed to harvest, due to high MSC concentrations in oysters, and thus exposure was zero.
Figure 2. Distribution of Risk of NoV infection in a population where a sub-population has consumed oysters from a bed exposed to a sewage overflow 7 days prior to harvest with a) 5 hr combined sewer overflow and b) 30 hr combined sewer overflow
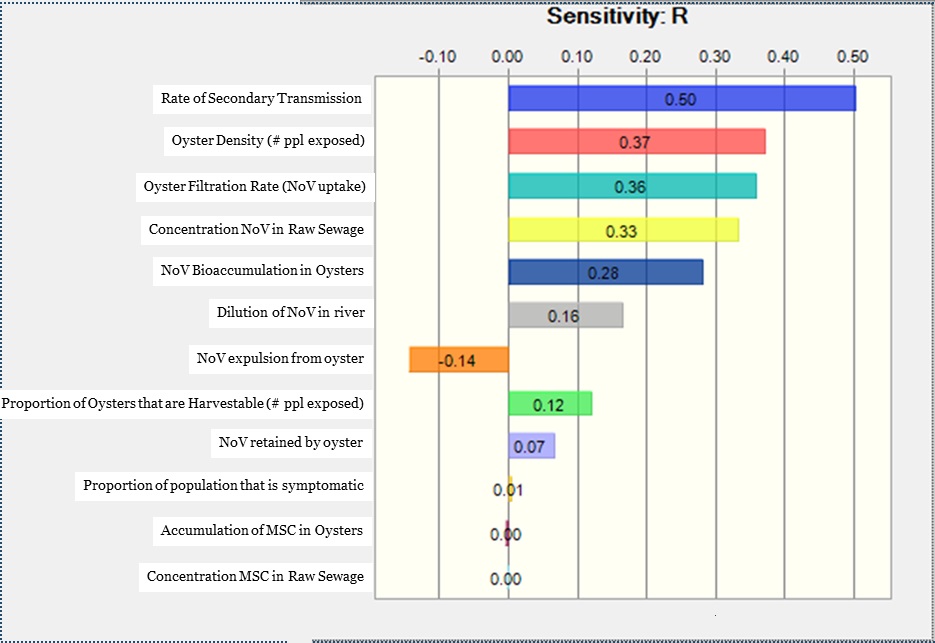
There were four main components of the model that contributed most to the model uncertainty (Figure 3). The largest contributor to uncertainty in risk was the rate of secondary transmission (ρ=0.5). Second, two variables related to number of people exposed to contaminated oysters - oyster density (ρ=0.37) and proportions of oysters that are harvestable (ρ=0.12), contributed to uncertainty. This is because we assumed that all oysters harvested from the system were consumed, and each consumer ate 12 oysters. Thus as the number of oysters harvested from the bed increases, so does the number of people exposed. Third, the variables related to how oysters process NoV all contributed to uncertainty - oyster filtration rate (ρ=0.36), NoV bioaccumulation rate (ρ=0.28), NoV retention (ρ=0.07), and NoV expulsion from oysters (ρ=-0.14). Expulsion rates had a negative ρ as greater expulsion of NoV from the oyster reduces the pathogen exposure. Finally, two variables that affect the NoV loading at the oyster bed increase the uncertainty - the concentration of NoV in raw sewage (ρ=0.33) and dilution of sewage in the river (ρ=0.16).
Figure 3. Sensitivity analysis
In our scenario analysis, we compared three alternative NSSP guidelines. In the 5 hour overflow scenario, the risk to the population wasn’t reduced when the limit of allowable male-specific coliphage per oyster was halved, likely because nearly all simulations in the initial scenario were already well below this limit. However, extending the minimum wait time before testing to 15 days more than halved the final risk to the population (Table 1). Waiting a month before allowing opening to harvest further decreased the risk.
Table 1: Scenario Analysis 5 hour overflow event
In the 30 hour overflow scenario, the risk to the population was reduced by 60% when the limit of allowable male-specific coliphage per oyster was halved, likely because the simulations where the oyster bed was kept closed and exposure was zero were increasing. Extending the minimum wait time before testing to 15 days or 30 days did not decrease risk in this scenario, likely because NoV and MSC levels were still high (Table 2).
Table 2. Scenario Analysis 30 Hour Overflow Event
Risk Management & Communication
The quantitative microbial risk assessment for NoV in oyster due to a point source contamination from sewage overflow has the following primary stakeholders:
● Federal government, and
● Local government.
Each of these stakeholders requires a different communication strategy because their interests and concerns into NoV contamination in shellfish are different. The following are risk communication strategies for each of the two stakeholders identified.
Federal Government
The FDA National Shellfish Sanitation Program is the regulatory arm that provides recommendations for oysters. As such approaching them with recommendations to update the length of time that the oysters beds are closed after sewage overflow. In addition to the QMRA, an appropriate cost-benefit analysis of extending the length of time to harvest from 7 to 15 days would have to be conducted. This would include the cost of extending bed closures to harvesters, restaurants and retailers, and consumers compared to the cost of an NoV outbreak. This information would be conveyed to FDA in a research briefing meeting that would occur either in person or over the phone depending on funds.
Local Government
Enacting policy change at the federal level can take a long time, as such approaching local state and regional government to discuss the findings of the QMRA and future cost-benefit analysis could result in quicker policy change. The methods of communicating with local government would be similar to the federal government but the scope of the policy recommendations and justifications would be regionally specific.


