| Experiment ID |
153, 157, 159, 214, 216, 217
|
|---|---|
| Pathogen | |
| Agent Strain |
EPEC E2348/69 (O127:H6)
|
| Contains Preferred Model |
No
|
| Reference |
Tacket, C. O., Sztein, M. B., Losonsky, G. ., Abe, A. ., Finlay, B. B., McNamara, B. P., … Donnenberg, M. S. (2000). Role of EspB in Experimental Human Enteropathogenic Escherichia coli Infection. Infection and Immunity, 68, 6. |
| Exposure Route |
oral (w. 2g NaHCO3)
|
| Response |
diarrhea
|
| Host type |
human
|
||||||||||||||||||||
|---|---|---|---|---|---|---|---|---|---|---|---|---|---|---|---|---|---|---|---|---|---|
| # of Doses |
11.00
|
||||||||||||||||||||
| Dose Units |
CFU
|
||||||||||||||||||||
| Μodel |
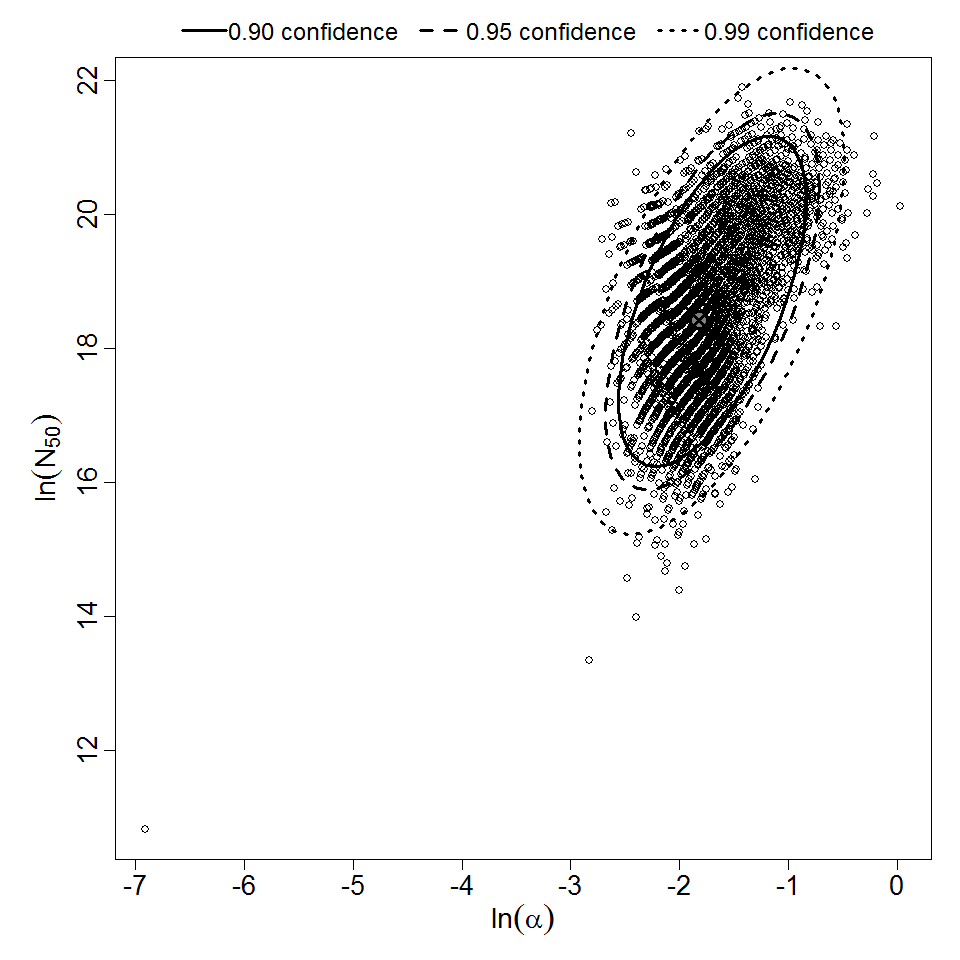
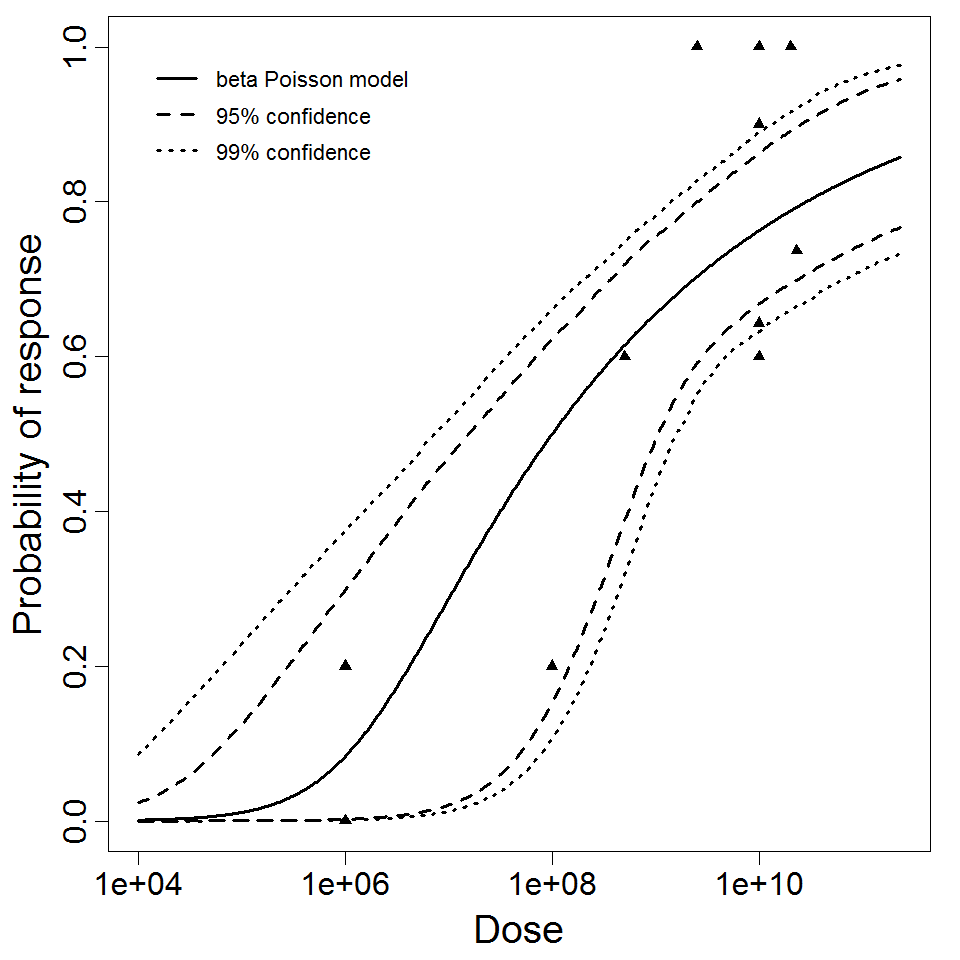
beta-Poisson
|
||||||||||||||||||||
| a |
1.62E-01
|
||||||||||||||||||||
| N50 |
9.98E+07
|
||||||||||||||||||||
| LD50/ID50 |
9.98E+07
|
||||||||||||||||||||
| Experiment Dataset |
|
Description
|
| ||||||||||||||||||||||
| ||||||||||||||||||||||||||||||