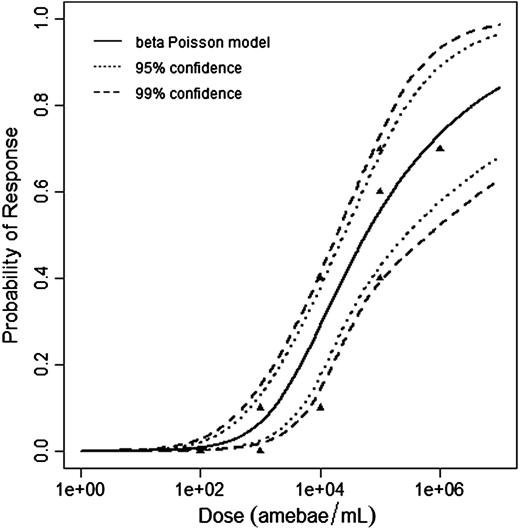
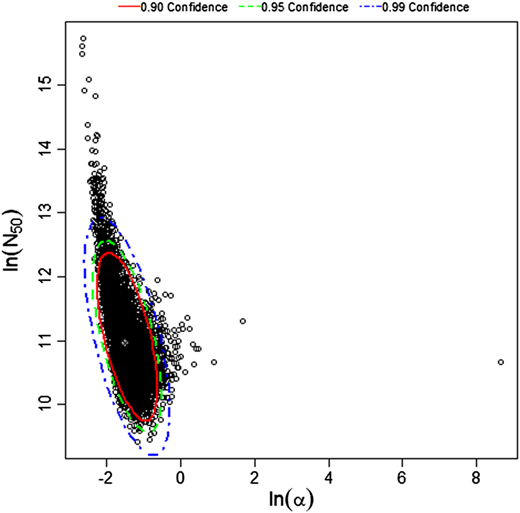
| Experiment ID |
954,955,956,957
|
|---|---|
| Pathogen | |
| Contains Preferred Model |
No
|
| Reference |
Dean, K. ., Weir, M. H., & Mitchell, J. . (2018). Development of a dose–response model for Naegleria fowleri. Journal of Water and Health, 17, 63-71. https://doi.org/10.2166/wh.2018.181 (Original work published) |
| Exposure Route |
Swimming for 5
10 or 20 minutes
|
| Response |
death
|
| Host |
CD1 Mice
|
||||||||||||||||||||
|---|---|---|---|---|---|---|---|---|---|---|---|---|---|---|---|---|---|---|---|---|---|
| # of Doses |
13.00
|
||||||||||||||||||||
| Dose Units |
no of trophozoites
|
||||||||||||||||||||
| Μodel |
beta-Poisson
|
||||||||||||||||||||
| a |
0.226
|
||||||||||||||||||||
| N50 |
5.79E+04
|
||||||||||||||||||||
| LD50/ID50 |
5.79E+04
|
||||||||||||||||||||
| Experiment Dataset |
|
Description
|
|

