| Experiment ID |
79
|
|---|---|
| Pathogen | |
| Agent Strain |
Quailes
|
| Contains Preferred Model |
No
|
| Reference |
Hornick, R. B., Greisman, S. ., Woodward, T. E., DuPont, H. L., Dawkins, A. T., & Snyder, M. J. (1970). Typhoid fever: pathogenesis and immunologic control. The New England Journal of Medicine, 283, 13. |
| Exposure Route |
oral (in milk)
|
| Response |
disease
|
| Host type |
human
|
|---|---|
| # of Doses |
3.00
|
| Dose Units |
CFU
|
| Μodel |
beta-Poisson
|
| a |
1.11E-01
|
| N50 |
3.45E+06
|
| LD50/ID50 |
3.45E+06"
|
Description
|
|
||||||||||||||||||||||
|
||||||||||||||||||||||||||||||
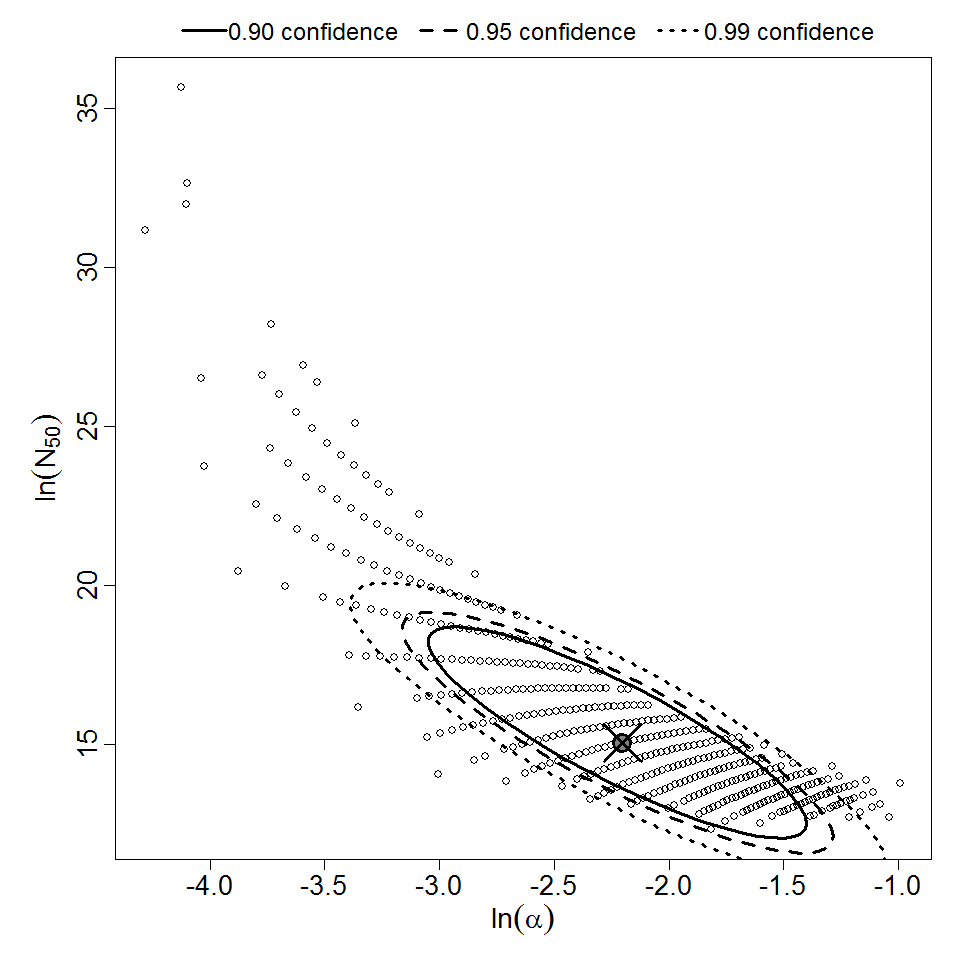
Parameter scatter plot for beta Poisson model ellipses signify the 0.9, 0.95 and 0.99 confidence of the parameters.
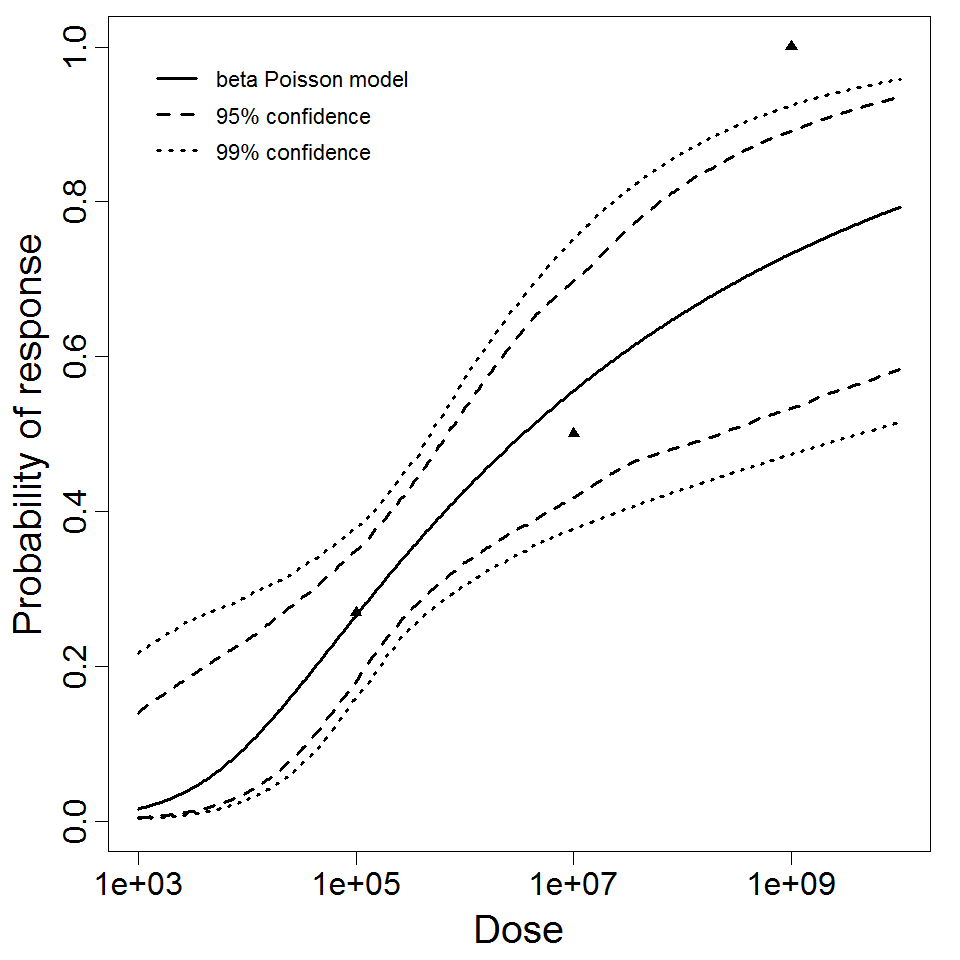
beta Poisson model plot, with confidence bounds around optimized model