| Experiment ID |
126
|
|---|---|
| Pathogen | |
| Agent Strain |
Inaba 569B
|
| Contains Preferred Model |
No
|
| Reference |
Kotak, B. G., Kenefick, S. L., Fritz, D. L., Rousseaux, C. G., Prepas, E. E., & Hrudey, S. E. (1993). Occurrence and toxicological evaluation of cyanobacterial toxins in Alberta lakes and farm dugouts. Water Research, 27, 3. |
| Exposure Route |
oral (with NaHCO3)
|
| Response |
any diarrhea
|
| Host type |
human
|
|---|---|
| # of Doses |
6.00
|
| Dose Units |
CFU
|
| Μodel |
beta-Poisson
|
| a |
3.18E-01
|
| N50 |
6.82E+03
|
| LD50/ID50 |
6.82E+03
|
Description
|
|
||||||||||||||||||||||
|
||||||||||||||||||||||||||||||
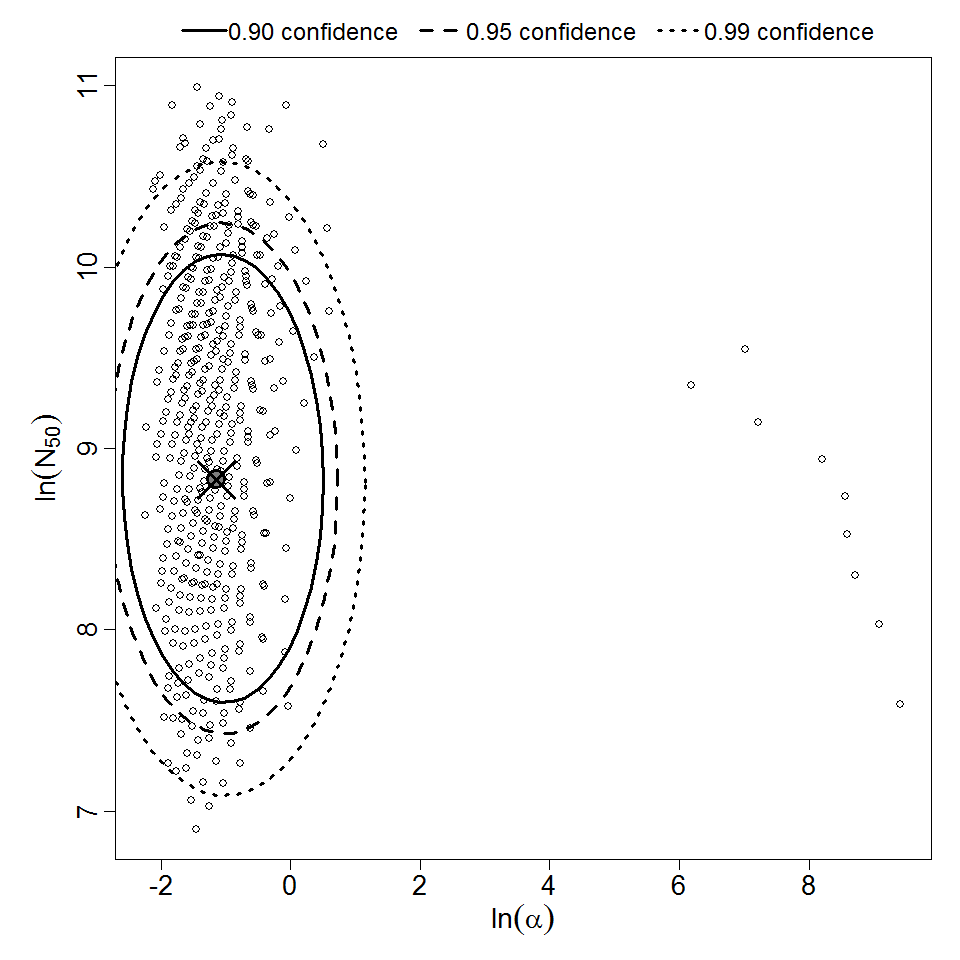
Parameter scatter plot for beta Poisson model ellipses signify the 0.9, 0.95 and 0.99 confidence of the parameters.

beta Poisson model plot, with confidence bounds around optimized model