| Experiment ID |
35
|
|---|---|
| Pathogen | |
| Agent Strain |
Inaba 569B
|
| Contains Preferred Model |
No
|
| Reference |
Hornick, R. B., Music, S. I., Wenzel, R. ., Cash, R. ., Libonati, J. P., Snyder, M. J., & Woodward, T. E. (1971). The Broad Street pump revisited: response of volunteers to ingested cholera vibrios. Bulletin of the New York Academy of Medicine, 47, 10. Retrieved from https://www.ncbi.nlm.nih.gov/pmc/articles/PMC1749960/ |
| Exposure Route |
oral (no NaHCO3)
|
| Response |
diarrhea or culture positive
|
| Host type |
human
|
|---|---|
| # of Doses |
7.00
|
| Dose Units |
CFU
|
| Μodel |
beta-Poisson
|
| a |
1.98E-01
|
| N50 |
6.36E+08
|
| LD50/ID50 |
6.36E+08
|
Description
Please Note
The results from this experiment are not recommended for use, rather they are present for reference purposes. The confidence intervals are not complete for this experiment since the data is not allowing for a stable bootstrap outcome. It is recommended to use the recommended model as this data is likely just capable of passing the test of trend, but still likely suboptimal for dose response modeling purposes.
|
|
||||||||||||||||||||||
|
||||||||||||||||||||||||||||||
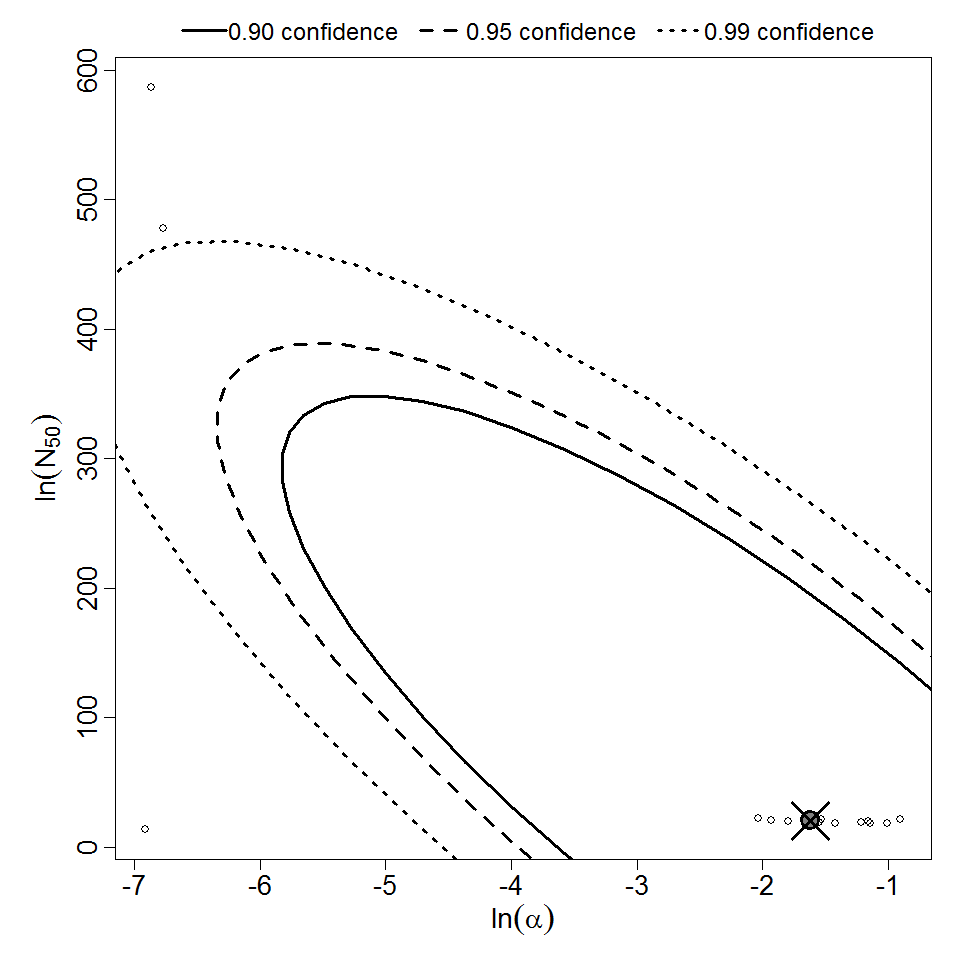
Parameter scatter plot for beta Poisson model ellipses signify the 0.9, 0.95 and 0.99 confidence of the parameters.

beta Poisson model plot, with confidence bounds around optimized model