| Experiment ID |
3
|
|---|---|
| Pathogen | |
| Agent Strain |
CO92
|
| Contains Preferred Model |
No
|
| Reference |
Rogers, J. . , V, Choi, Y. W., Giannunzio, L. F., Sabourin, P. J., Bornman, D. M., Blosser, E. G., & Clk, S. . (2007). Transcriptional responses in spleens from mice exposed to Yersinia pestis CO92. Microbial Pathogenesis, 43, 2. https://doi.org/10.1016/j.micpath.2007.04.001 |
| Exposure Route |
intraperitoneal
|
| Response |
death
|
| Host type |
mice
|
|---|---|
| # of Doses |
5.00
|
| Dose Units |
CFU
|
| Μodel |
exponential
|
| k |
3.45E-02
|
| LD50/ID50 |
2.01E+01
|
Description
|
|
||||||||||||||||||||||
|
||||||||||||||||||||||||||||||||||||||

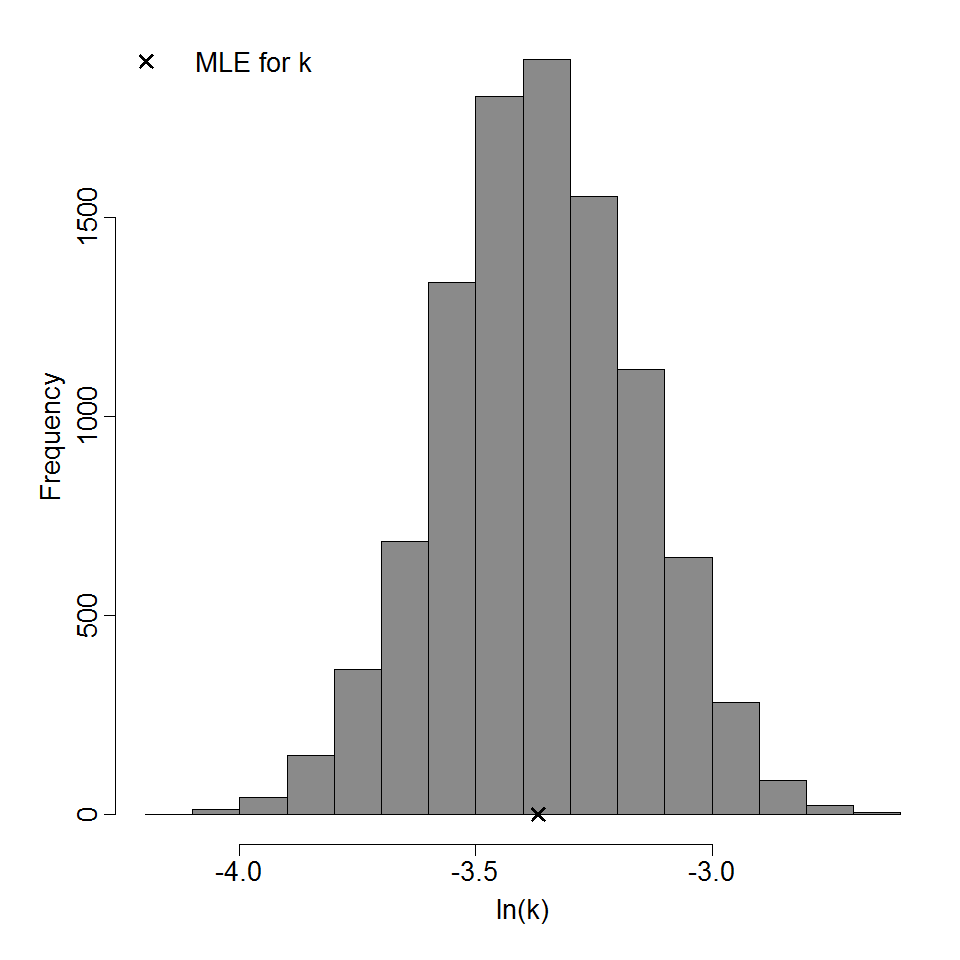
Parameter histogram for exponential model (uncertainty of the parameter)

Exponential model plot, with confidence bounds around optimized model