Team Members: Christensen, S., Donocik, A., Gkogka, E., Katuzika, A., Velten, S. & Zurbruegg, R.
Problem Statement
Abstract
Quantitative Microbial Risk Assessment was used to asses the risk of getting infected with the bacteria Coxiella burnetii when passing an infected farm by bicycle during the tourist season May-August in the Netherlands. The risk was estimated by calculating the exposure in the affected areas and using two different beta Poisson models for the healthy and the susceptible population. A safe distance of 20 km is recommended when passing infected farms by bicycle. Recommendations should be targeted towards the immunocompromised people since they are at much higher risk of contracting the disease.
Introduction
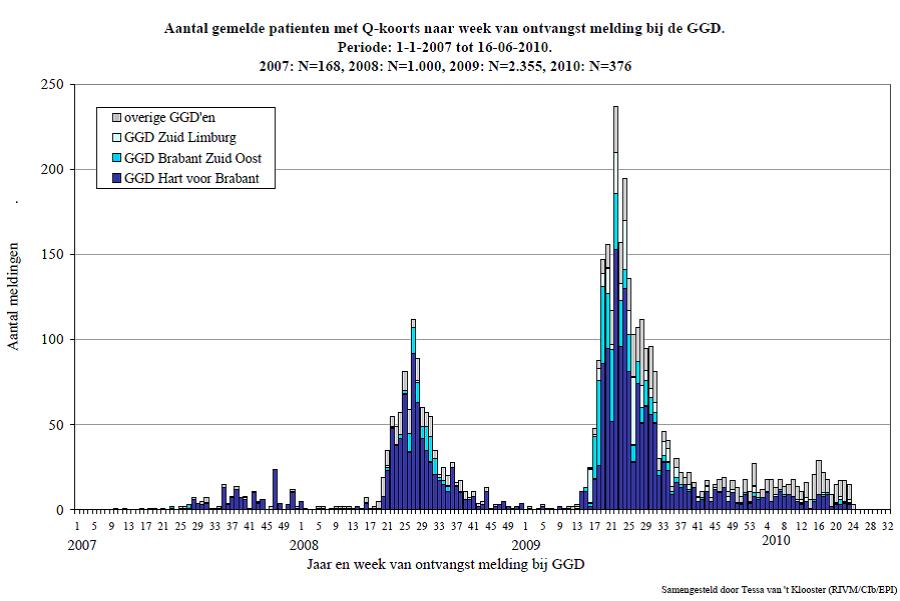
In 2007 the first incident of Q-fever in humans was reported from the Netherlands. The following two year a rise in infections was observed with more than 3500 reported cases of human infection (Karagiannis et al.). Q-fever is spread worldwide with the exception of New Zeeland. The first case of the disease occurred in Queensland, Australia in 1935. In 1937 it was discovered that the disease was caused by a bacterium, Coxiella burnetii, named after the researchers Cox and Burnet (RIVM). In the period 1981 -2007 53 Q-fever epidemic cases were described worldwide. An outbreak in Uruguay in 1956 occurred among employees of a meat factory with 814 persons of 1358 getting infected. Another major outbreak occurred in Switzerland in 1987. This outbreak became apparent three weeks after around 900 sheep went down from the alpine pastures to the valley, and 21 % of the inhabitants along the route got infected (RIVM). In 2007 there was an outbreak of Q fever in the Dutch province of Noord-Brabant with in total 168 cases. In 2008 there was an outbreak in several regions with approx. 1000 cases of Q fever reported. In 2009 the number of patients increased to around approx. 2300. At that point it was the biggest epidemics of Q-fever in the world.
Coxiella burnetii is an obligately intracellular gram-negative bacteria in the size range 0.3-0.7 µm. C. burnetii is able to form small spores (0.1-0.2 µm) (McCaul & Williams), which are resistant to drying or heat and hence remarkably stable in extracellular environments (Snyder). The spores can survive for months and years in the environment (Hugo et al., 2004). C. burnetii is highly infectious, with one organism causing clinical infection (Madariaga et al.). The incubation period is 2-3 weeks (Angelikalis and Raoult) and the symptoms of Q fever are generally nonspecific. There are multiple presentations, most commonly pneumonia, hepatitis, or fever only (Raoult et al.). Acute Q fever is characterized by sudden onset of high fever, headache, muscle and joint pain, cough and, less frequently, rash or a meningeal syndrome. Patients often have elevated liver enzyme levels and erythrocyte sedimentation rates. Development of chronic Q fever can occur up to 20 years after the initial infection. The major complication of chronic Q fever is endocarditis (Snyder).
Only 60 % of infected persons have symptoms. 20% of infected persons seek medical attention, and 2 to 3% are admitted to a hospital (Delsing & Kullberg). Overall, the mortality rate of Q fever is low, approximately 1-2 % (Tissot-Dupont et al.), but it may be as high as 65% among those with chronic Q fever (Raoult et al.).
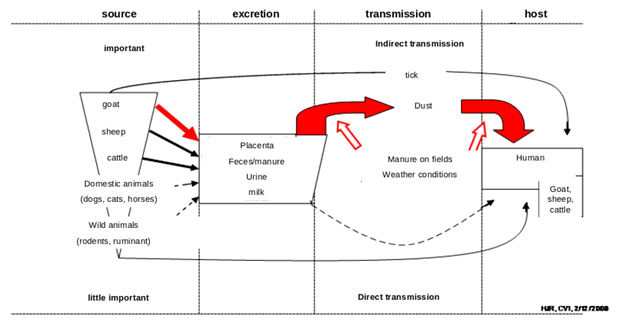
Coxiella burnetii occur in nature and is responsible for infection in various mammals, and in birds, reptiles and fish. Ticks are considered to be the natural primary reservoirs of C. burnetii responsible for the spread of the infection in wild animals and for transmission of C. burnetii from wild to domestic animals. Among domestic animals, cattle, sheep and goats are considered to be the main reservoirs of the agent responsible for infection of humans (Norlander). Q-fever outbreaks have been associated with farm animals specifically from animal birth products and excreta. Various routes of infections are known but the primary path of infection in humans is by inhalation of air that contains barnyard dust.
In 2007 the Dutch government made initiatives to avoid transmission of Q-fever from animals to humans. Firstly goats were vaccinated in the risk regions. Another measures included a breeding ban, a ban to spread manure on fields, a ban on visiting infected farms, a duty to notify the authorities about Q-fever cases and a duty to test milk in bulk tanks. Due to the lack of effect the Dutch government decided to kill (cull) pregnant animals on infected farms in December 2009. This did not eradicate Q-fever in the Netherlands but substantially decreased the number of infections (fig.1) (RIVM). Though the number of infected farms has decreased, the risk of infection when passing an infected farm still needs to be considered. Transportation in open vehicles or by foot in agricultural areas is a known way of contagion (Carrieri et al.). During tourist season a vast number of people pass through agricultural land by bike and are thereby in risk of getting infected.
Quantitative Microbial Risk Assessment (QMRA) can provide information on the risk associated with presence in the vicinity of infected farms and provide us with guideline values to concerning transportation in open vehicles in infected areas.
In this study the risk when passing a Coxiella burnetii infected farm by bicycle is assessed by QMRA, and recommendations of safe distances are given.
Hazard Identification
Exposure Assessment
Detection of Coxiella burnetii
Molecular detection by PCR: This detection is rapid, sensitive and specific. PCR (polymerase chain reaction) can be applied for different matrices such as: milk, semen, urine, feces, placenta of animals but also in manure, aerosols etc. This method is still not 100 % reliable because there are some problems with inhibition of the primers.
Culture detection: Methods have only recently been developed and is not available in most laboratories. There is also a high infection risk to laboratory personnel.
Serological detection: Mostly used in humans, but they are not useful to screen animals. For example, serum antibodies are detectable about 2 weeks after the initial infection of sheep. The antibody concentrations reach a maximum at 30 to 60 days, then rapidly decline and phase into seasonal antibody cycle of the rest of the flock in relation to the lambing season (Mc.Caul and Williams 1981). Therefore, if the infected sheep is tested by serology during the low point of the cycle, when antibody concentration is below the detection level, the results will be misleading.
Coxiella burnetii emission
Placenta contribution: The main emission of C. burnetii happens during birthing in the form of amniotic fluids and the placenta. It is generally assumed that C. burnetii can occur up to a concentration of 109 per placenta (van Woerden et al.). For this study this source is assumed to be the main source of contamination.
Feces contribution: C. burnetii is also excreted with feces. The concentration of C. burnetii in feces can be found in a range of 103–104 per g feces (Ryan G. Sinclair et al.). Considering a daily production of 2.35 kg feces per goat (NCSU), the concentration of C. burnetii results in 2.5 x 10⁶– 2.5 x 10⁷ per goat per day. Assuming a homogeneous distribution of 500 to 4000 goats per barn and an infection rate of 20%, this results in 2.5 x 10⁸– 2 x 10¹⁰ per barn per day. Considering that this is in the same order of magnitude the contribution of feces is relevant. Due to the high uncertainty of available data we decide to consider the contribution of feces as an uncertain parameter of 25 - 2000% of the concentration of one placenta by assuming a triangle distribution with the median at 100%. We take the median at approximately 25% of the range of values, since the infection rate of goats is also skewed towards the lower end.
Inactivation of Coxiella burnetii
C. burnetii spore like forms are resilient. They can withstand pressures of up to 20,000 lb/in2, elevated temperatures, desiccation, osmotic shock, UV light and chemical disinfectants. Experimental studies of the survival of C. burnetii spore like forms have not demonstrated survival beyond 8 years (Table 1) (van Woerden et al.). Whether experiments for longer durations were undertaken is not clear from the source documents. Compared to other pathogens, the survival rate of C. burnetii is very high (Sinclair et al.). Decimal reduction times (DRT) of C. burnetii in a manure pile are given in Table 2. The DRT, also known as D value, gives the time required at a certain temperature to kill 90% of the organisms being studied. The data show that with increasing time the decimal reduction of C. burnetii decreases. At 20 °C, the relevant temperature for this case, the DCT takes 30.49 d. For this study the inactivation time of C. burnetii is insignificant compared to the length of the investigation period. Therefore, based on the available information, we consider the inactivation rate for C. burnetii spores to be negligible in this assessment.
Survival of Coxiella burnetiia in different media (van Woerden et al.)
| Environment | Temperature (Celsius) | Survival |
|---|---|---|
| Wool | 15–20 | 7–9 mo |
| Wool | 4–6 Approx. | 12 mo |
| Sand | 15–20 | 4 mo |
| Fresh meat | Cold storage | >1 mo |
| Salt meat | Not recorded | 5 mo |
| Skimmed milk | Not recorded | 40 mo |
| Tap water | Not recorded | 30 mo |
| Tick feces | Room | Conclusive evidence: 586 d, Some evidence: 6 and 8 y |
| Not recorded | –20 | 2 y |
| Not recorded | –65 | 8 y |
DRT (decimal reduction time) of C. burnetii in a manure pile (Roest et al.)
| Temperature (°C) | DRT (sec) | DRT (min) | DRT (h) | DRT (d) |
|---|---|---|---|---|
| 20 | 2634275.25 | 43904.59 | 731.74 | 30.49 |
| 30 | 191208. 29 | 3186.80 | 53.11 | 2.21 |
| 40 | 13878.81 | 231.31 | 3.86 | 0.16 |
| 50 | 1007.39 | 16.79 | 0.28 | 0.01 |
| 60 | 73.12 | 1.22 | 0.02 | |
| 70 | 5.31 | 0.09 |
Concept
In order to accomplish a QMRA for q-fever infection for cyclists in the Netherlands an emission – infection model was set up. The scenario is based on data from summer season 2009 (1 June – 31 August 2009) in the area around Eindhoven, where Q-fever primarily occurred in 2008 and 2009.
The scenario includes C. burnetii emissions from a goat farm, transport (plume model) through air and uptake by a cyclist (dose-response model)
\begin{align*} C(x,y,z) = \frac{Q}{2\pi \sigma_z \sigma_y u}e^{-\frac{y^2}{2\sigma_y^2}}e^{-\frac{(z-h)^2}{2\sigma_z^2}} \end{align*}
Emissions are assumed to happen by cells reaching the air from placentas after birth by infected goats. As birth time and occurrence of Q-fever are not correlated temporally (Tissot-Dupont), a constant birth rate was assumed during a 4 months period (May – August) for simplicity. A gaussian point source plume model (Eq. 1) was used to model air concentrations of cells at distance x in the main wind direction and distance y perpendicular to the main wind direction which is North-Northeast (KNMI). Only the main wind direction was considered, since Schimmer et al. show that the main direction is crucial for arerial C. burnetii spread. Steady state was assumed and clear weather was assumed. Distances, where cells in air have been found in the Netherlands previously range from 500 to 5000m (De Bruin et al.).
The following assumptions were used:
The following are key uncertainties in the estimation of total cases
Dose response
Dose-response assessment
In order to relate concentrations of C. burnetii in the atmosphere with cases in the human population a dose response model in necessary. A summary of all existing dose response models can be seen in the figure below.
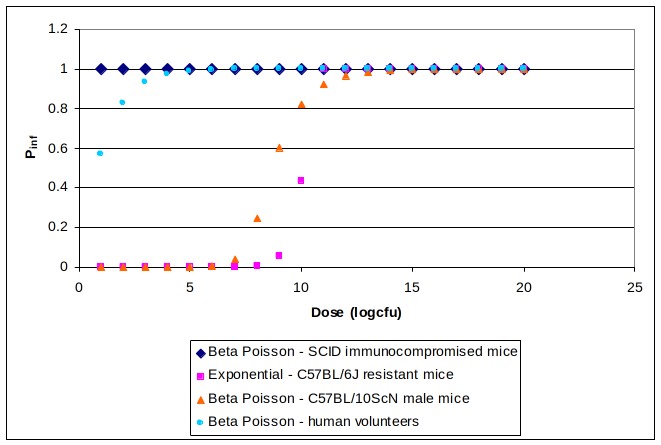
The equations and parameters for the models presented in Figure 3.1 can be found in Appendix I. It was considered that the model based on human volunteer data (Tigertt and Benenson) is the most representative one for the healthy human population since it is based on healthy human subjects and involves inhalation as the route of infection in contrast with all the mice models that are based on intra-peritoneal injection. Due to the fact that the models based on healthy mice are all less conservative than the one based on healthy humans it was considered appropriate to assume the very conservative model for the immunocompromised SCID mice suitable for the susceptible part of the human population consisted of old, pregnant and immunocompromised individuals. The population at risk of infection was considered to be all the seronegative individuals (Karagiannis et al.) and the percentage of YOPI was based on data from the Netherlands Bureau of Statistics (CBS).
Disability Adjusted Life Years
Cases estimated by combining the hazard characterization and the exposure assessment part of the risk assessment were used to estimate DALY, selecting the formulas that do not include age weighting or discounting (Arnesen and Kapiriri, 2004). For the purpose of these calculations all cases were considered to be initially cases of acute Q fever and 1.86% of these cases were considered to result in chronic Q fever (ECDC). Cases of acute Q fever most often present with influenza like symptoms (ECDC) and therefore were assigned a disability weight of 0.220 based on the rationale of Murray (Murray). We considered that 20% of acute cases develop pneumonia (ECDC) and therefore estimated YLD for this sequelae as well. For the chronic cases of Q fever, endocarditis is the most common form of Q fever (Schimmer et al.) was therefore used for the estimation of DALY associated with this form of the disease. The value choices for the DALY formula can be seen in Appendix II. Disability weights were derived from the study of Lopez and Mathers (Lopez and Mathers).
Tables IIa and IIb. Value choices used in the DALY formula. Sources: ECDC; Lopez and Mathers; CBS.
IIa.
| Age of illness | Case fatality | Life span at the age of death | |
|---|---|---|---|
| Acute Q fever | 52.8 | 0.015 | 27.5 |
| Chronic Q fever | 52.8 | 0.3 | 27.5 |
IIb.
| Duration (years) | Disability weight | |
|---|---|---|
| Acute Q fever (influenza like illness) | 0.038356164 | 0.22 |
| - acute Q fever associated pneumonia | 0.038356164 | 0.279 |
| Chronic Q fever (endocarditis) | 27.5 | 0.252 |
Risk Characterization
Distribution of dose and infection probability


The distribution of the dose (shown is 100 m distance from the farm) shows the highest probability around 0.006 cells which equals to a infection probability of healthy people of 0.16%. The range of doses covers an interval of 0 – 0.015, the infection probability ranges from 0 to 0.9%. Both parameters show a similar distribution shape, caused by the compilation of the distribution of the input parameters.
Distribution of total cases and DALYs
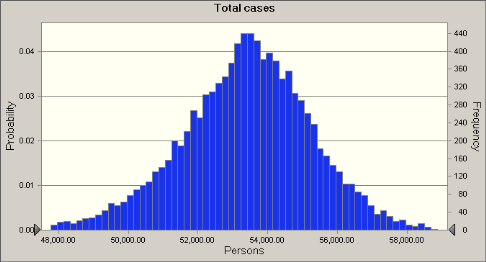
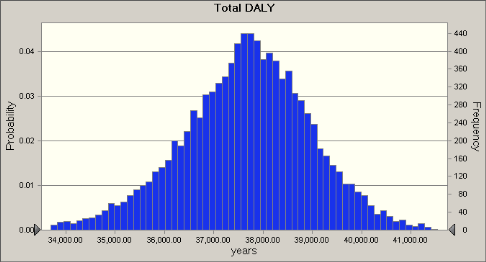
A number of 1,000,000 inhabitats (healthy and immunocompromized) were assumed to characterize the effect of Q-fever on the local population. The calculated distribution (100 m distance) of the total cases has a mean of ca. 54,000, which corresponds to a DALY of ca. 38,00 years.
Effect of distance to the infected farm
The mean values of four parameters after 10,000 Monte Carlo simulations based on an integrated dose when riding through the emission plume show declining numbers with distance. The infection proability for healthy people decreases from 0.16% at 100 m distance to < 0.01% at 20 km from the farm.
| Means of Parameters as Function of Distance from the Barn | ||||
|---|---|---|---|---|
| Distance | Dose (cells) | Infection probability (%) | Total cases | Total DALY (yr) |
| 100 m | 0.0059 | 0.160 | 53324 | 37617 |
| 2000 m | 0.0022 | 0.059 | 50098 | 35341 |
| 20000 m | 0.0003 | 0.009 | 40434 | 28523 |
Risk Management & Communication
Discussion
Safe distance from the farm – how uncertain is the distance? Healthy individuals should avoid cycling at a distance closer than 2 km to the farm. This distance should be increased to 20 km for the susceptible population. To prevent confusion though it might be wiser to use the latter value for both groups.
Key uncertainties are the emission from the manure and the speed of the wind (see Annex III). There is no dose response model based on human data for the immunocompromised population. Thus a dose response based on mice data was used that is not based on the primary mode of infection of the disease (inhalation) but on intra-peritoneal injection.
Preventory measures to diminish the spread of Q-fever can be taken by:
- Burning and burying reproductive offal
- Antibiotic treatment for animals
- Vaccination for human beings
The estimates could be further improved by research in the following areas:
- Dose response relationship for C. burnetii.
- Data on the concentration and survival of the pathogen in manure
- Data on the immunocompomised individuals: percentage among the population and cycling habits
Communication: Surveys have shown that the greatest trust lie in local and national authorities (de Roda Husman, pers. comm.). Homepages of these authorities will be used to communicate the main messages: For immunocompromised people completely to avoid infected areas and for the cyclist to keep a safe distance to infected farms. Signs will be put up in areas warning people that they are entering an area of infection.
Conclusion
The following can be drawn from this risk assessment:
- The risk declines significantly based on the distance to the farm. People should be advised not to cycle at a distance closer than 20 km.
- For all scenarios the risk for the immunocompromised is much higher than for the healthy population. Therefore special advice should be given to this sensitive sub-group of the population.
