Team members: Aggarwal, S., Balogun, A., Huang, C., Ji, P., Phillips, L., Schmitz, B.
Problem Statement
Legionella pneumophila (Lp), alongside with several other opportunistic pathogens, has been ranked as the top contributor of waterborne disease in the U.S. for the past several years. A recent potentially Lp-associated water crisis happened in Flint, Michigan. A spike in Legionnaires’ disease was observed in Genesee County (where Flint locates), with 45 cases including 5 deaths reported from June 2014 to March 2015, and 46 cases including 7 deaths reported from May to October 2015 (MDHHS[1]). This is concurrent with the period the City of Flint switched its water source to local Flint river from Detroit municipal water (April 25, 2014 - October 16, 2015). Of the 91 cases in total, 65 were associated with people whose homes were receiving Flint water or who had visited Flint hospitals during that period (Schwake et al.[2]). It is therefore speculated that the spike in Legionnaires’ disease may be associated with the Flint River water. Few studies have documented Flint’s Legionella outbreak from the risk assessment perspective.
Quantitative Microbial Risk Assessment (QMRA) is an effective approach that incorporates mathematical models into available data under stated assumptions and ultimately determine the adverse outcomes (e.g., public health loss, economic burden). The present case study proposes a QMRA approach to estimate Lp exposure risk under a simulated case in the Flint water crisis, where epidemiology data was used to estimate Lp concentration in water. Other exposure scenarios, including toilet flushing and humidifiers are compared as well. Some questions of interest include: (1) if Flint residents are subjected to a lower risk of Legionella exposure through showering events after Flint switched back to Detroit water; (2) given the current public concerns, we would like to know if Flint residents are experiencing higher risk of Lp exposure compared to the U.S. public on average under normal shower length and frequency.
Hazard Identification
Legionella has been identified as a major hazard associated with waterborne diseases, responsible for 66% and 26% of waterborne outbreaks and illnesses in the United States from 2011 to 2012 (Beer et al.[3]). Recently, Lp has impacted Flint, Michigan due to inadequate potable water sources and improper water management. Generally, Lp can be found in water distribution systems and at high concentrations where conditions are favorable for growth (e.g., low disinfectant residual and warm to hot water temperature). It is not uncommon that buildings with high water age or with low water use frequency experience decreased or even zero disinfectant residual. The City of Flint, Michigan recently had a water crisis where high lead levels were detected due to exacerbated pipe corrosion. As a byproduct of corrosion, Flint water had a faster chlorine decay rate compared to that of Detroit water (the prior water source), and high iron concentration as well. The lack of disinfectant and abundance of nutrients (especially iron) likely created an environment conducive to Lp growth. The population involved includes all Flint population and people who traveled/visited Flint during the period Flint was on Flint River water.
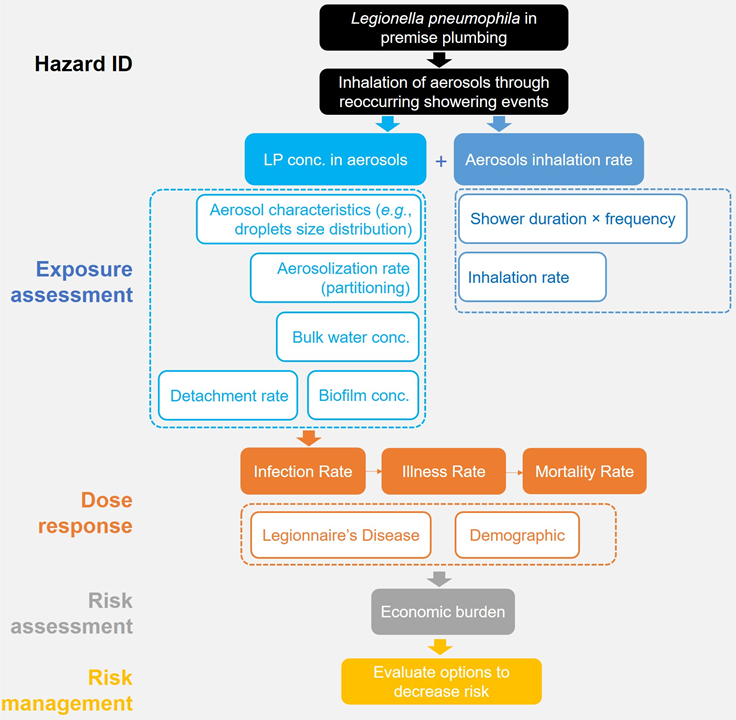
Figure 1. Flow chart of QMRA for Legionella pneumophila exposure risk for Flint residents during the water crisis.
The health outcome from Lp exposure includes Legionnaires’ disease (a pneumonic illness) and Pontiac fever (a systemic illness), with the former mostly identified and can result in death (Table 1) (Ashbolt[4]). In addition, Legionnaires’ disease has been identified as a major cause of community-acquired pneumonia (Ng[5]), which was the case in Flint, Michigan. Of the 54 Legionella species, 25 can cause human disease (Bartram[6];Yang et al.[7];Buse et al.[8]), and mostly impact immunocompromised and immunosuppressed individuals [Morio et al.[9]; Marston et al.[10]] including those aged ≥50 years, smokers, and persons with underlying medical conditions such as chronic lung disease.
Table 1: Clinical features of Legionella spp.
|
|
Legionnaires’ disease |
Pontiac fever |
|
Incubation Period |
2-10 days |
5 hours - 3 days |
|
Duration |
Weeks |
2 - 5 days |
|
Attack rate |
0.1 - 5% general population, 0.4-14% in hospitals |
95% of exposed population |
|
Isolation of organism |
Possible |
Not reported |
|
Symptoms |
Pneumonia, anorexia, malaise, fever, chills, lethargy, vomiting, diarrhea |
Fever, chills, vomiting, diarrhea (no pneumonia) |
|
Pathogenesis |
Replication of organism |
Endotoxin (inflammation) |
|
Hospitalization |
Common |
Uncommon |
|
Case-Fatality rate |
10% 30% healthcare-associated cases |
Not fatal |
Information gathered from Center of Disease Control[11] and QMRA III, 2016 (Ashbolt[4]).
Although virulent cells may be present in planktonic forms, they often prefer a niche within biofilms and often proliferate inside protozoan symbionts (Hamilton and Haas[12]). However, the diversity amongst opportunistic pathogenic Legionella within biofilms is relatively unknown (Gomez-Valero et al.[13]). Legionella occurs in domestic, recreational, and engineered water sources, such as premise piping, hot tubs, fountains, humidifiers, cooling towers, pools, spas, reservoirs, heaters, public fountains, and misters (Buse et al.[8]; Berk et al.[14]; Chen et al.[15]; Moore et al.[16]; Screiber et al.[17]; Zeybeck and Cotuk[18]; Bollin et al.[19]; Cowen and Ollison[20]; EPA[21]). Growth and persistence of Legionella spp. often correlates to numerous water quality parameters as well as the water age and infrastructure of piping systems (Buse et al.[8]). As biofilms linger within piping, portions slough or detach into flowing water that becomes aerosolized via showers, water faucets, humidifiers, therapy pools, and circulating toilets (Martinelli et al.[22]; Thomas et al.[23]; Hines et al.[24]). Therefore, these environments are likely points of concern for human exposure and inhalation of virulent cells associated with aerosols.
According to the Center for Disease Control and Prevention (CDC), 33 drinking water–associated outbreaks were reported from 2009 to 2010, comprising 1,040 cases of illness, 85 hospitalizations, and 9 deaths (CDC[25]). Legionella accounted for 58% of outbreaks and 7% of illnesses. The most commonly identified outbreak deficiencies in drinking water-associated outbreaks were Legionella in plumbing systems (57.6%), untreated ground water (24.2%), and distribution system deficiencies (12.1%), suggesting that efforts to identify and correct these deficiencies could prevent many outbreaks and illnesses associated with drinking water. (CDC, 2013). During 2000–2014, the rate of reported legionellosis cases increased from 0.42 to 1.62 per 100,000 persons and 4% of reported cases were outbreak-associated (Garrison[26]).
Exposure Assessment
As the major human pathogenic bacteria within the genus Legionella, Legionella pneumophila (Lp) has been identified as the main causative agent of Legionnaires’ disease. L. pneumophila is challenging to control as it is part of the drinking water microbial ecology. Premise plumbing (i.e., the portion of pipes within buildings that is connected to the distribution system but controlled by the building occupants/owners) has several unique features including high surface to volume ratio and intermittent stagnation, which contributed to the 10-times greater microbial load than that of full-scale drinking water distribution systems (Baron[27]). Thus, we identified that premise plumbing, rather than the distribution system, generates the majority of Lp exposure risks for residents. Lp is commonly found in the drinking water distribution system but usually at much higher concentration within premise plumbing. This Gram-negative bacterium can reside in the biofilm coating the walls of the pipes, where they are provided with nutrients to proliferate and they are protected from harsh environmental conditions including chlorine disinfection. Moreover, the microbial ecology within the biofilm, for instance, the symbiotic relationship between free-living amoeba and Lp is an essential link in Lp’s life cycle.
The major exposure route for Lp is through inhalation of aerosols containing infectious particles or inhalation of infectious particles directly. In addition to planktonic phase, biofilm sloughed off from premise plumbing containing Lp cells can transmit via the water spray through the showerhead, which can lead to spike in Lp concentration during shower event. Depending on particle size, the Lp-containing aerosols and sloughed-off biofilm segments might deposit deep into the lungs and invade alveolar macrophages, later possibly into the bloodstream from the lungs and propagation of Lp typically occurs in the body over the following days. Despite a recent study (Correia et al.[28]), person-to-person transmission of Lp is commonly regarded as unlikely. Besides the in-building premise plumbing system, outside-building cooling towers, decorative water fountains and hot tubs have been identified as potential Lp source.
In this case study, we specifically tested 5 exposure scenarios: (1) shower; (2) toilet flushing; (3) hot water faucet; (4) humidifier; (5) therapy pool. For shower case study we considered the scenario under the context of Flint water Lp concentration. For the rest scenarios regional or national average Lp data were retrieved. We utilized at-the-tap bulk water Lp concentrations measured by quantitative Polymerase Chain Reaction (qPCR) from Flint residential homes/buildings/hospitals sampled in August and October 2015 (Flint River, Detroit water as water source, respectively) (Schwake et al.[2]). The exposure assessment and dose-response model was modified from prior publications [5-6]. It needs to be emphasized here that there are other important scenarios for Lp exposure which are not discussed within this case study. For instance, travel is often perceived as a risk factor as it involves residence in locations with complex premise plumbing systems like hotels.
Dose Response
Shower scenario under Flint case study
The dose response model used in this study was the exponential model recommended according to the goodness of fit method on QMRA wiki. It was fitted by Legionella dose and infection data from Muller et al.[29]. The exponential model was shown as equation below.
r = 1-exp(-k*d)
In which, r is the probability of Legionella infection; k is the fitting parameter; d is the deposited Legionella dose in aveoli. The attack rate, i.e., the cases reported among population, is assumed to be similar to probability of Legionella infection. The optimized k parameter was shown below.
Table 2: Dose-Response Parameters (QMRA wiki[30])
|
Parameter |
MLE estimate |
Percentiles |
|||||
|
0.5% |
2.5% |
5% |
95% |
97.5% |
99.5% |
||
|
k |
5.99E-02 |
3.26E-02 |
3.90E-02 |
4.18E-02 |
1.11E-01 |
1.31E-01 |
1.57E-01 |
Multi-exposure scenario comparison
The daily and annual risks were calculated per the formulae provided below.
Daily Risk = Pd = 1-exp(-dose*k)
Annual Risk = 1- (1 - Pd)^365
Methods of Risk Management Evaluation
To simulate thermal eradication treatment, Lp concentrations were lowered per literature data and risk assessment was performed to evaluate corresponding risk reduction.
The modeling tool used in this case study is Oracle Crystal Ball, which is an Excel-based application developed for simulation, optimization and predictive modeling. Crystal Ball offers the opportunity to randomly generate specified distribution and simulate output with representable tables and figures. Monte Carlo is used in this study for 1000 trials of simulations.
Risk Characterization
Based on the case reported on legionnaires disease in Flint, MI, a reverse estimation of Lp concentration in a house-premise plumbing situation was simulated as shown in Figure 2.
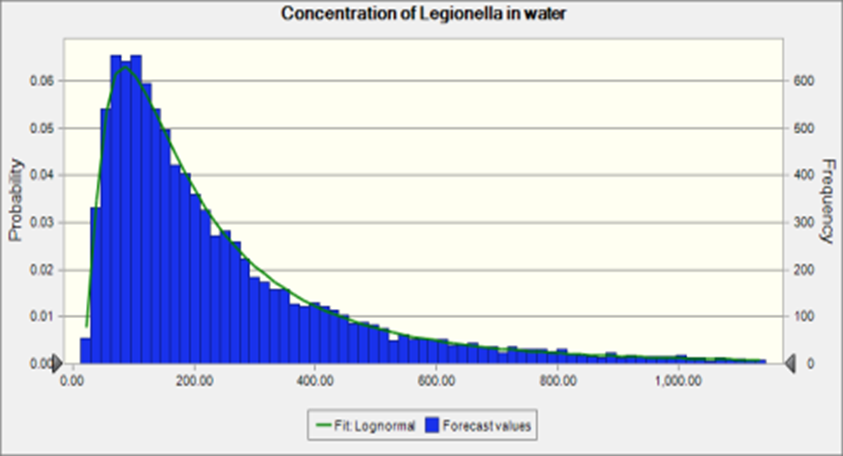
Figure 2. Concentration of Legionella in water
The mean is 276 CFU/L and the standard deviation is 310. The concentration is lower than the Lp concentration reported in Schwake et al.[2]. Since the assumption of the risk of infection and the percentage of legionnaires disease reported was similar, the estimated Lp concentration in water can be lower because the infected one may not be diagnosed and reported. According to the sensitivity analysis as shown in Figure 3, the partition of the Lp in water and aerosol can have relative important impact the risk of infection, which is consistent with the finding in (Schoen[31]).
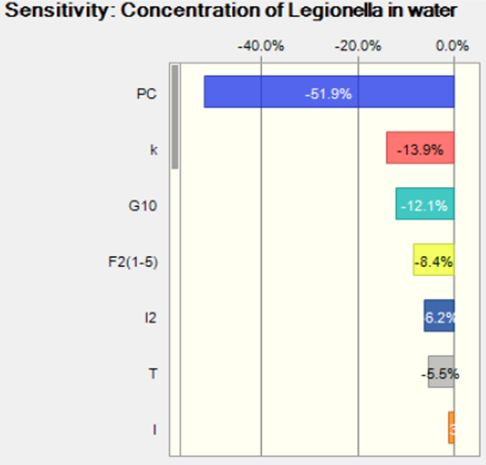
Figure 3. Sensitivity analysis for the concentration of Legionella in water
To further explore the risk of infection by shower exposure route, the Lp concentration reported in hospital just before the water source switch back to Detroit water was used as a source in the risk assessment. The risk of infection is shown in Figure 4.
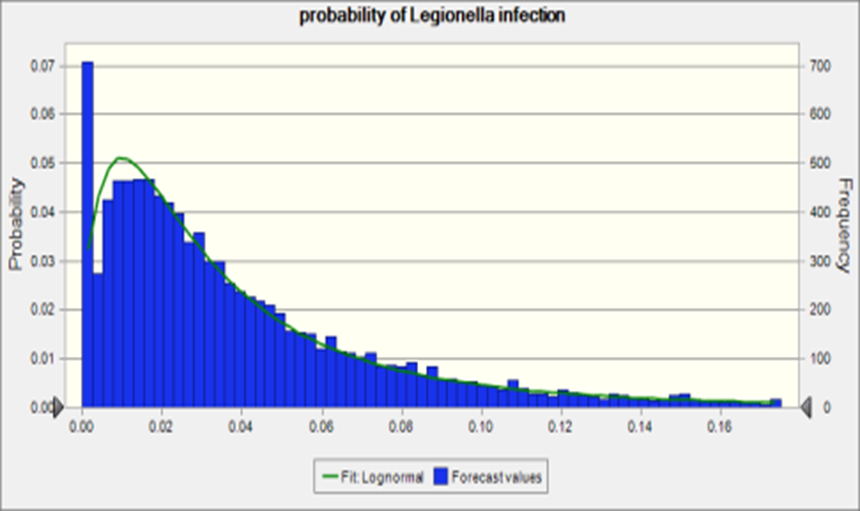
Figure 4. Probability of Legionella infection
The median of the risk of infection was 0.03 which is close to the attack rate, 0.02, (the case of legionnaire’s disease among the exposed population) reported in Flint, MI. The sensitivity analysis of this simulation is shown in Figure 5. Most of the parameter were consistent with the reverse estimation by attack rate.
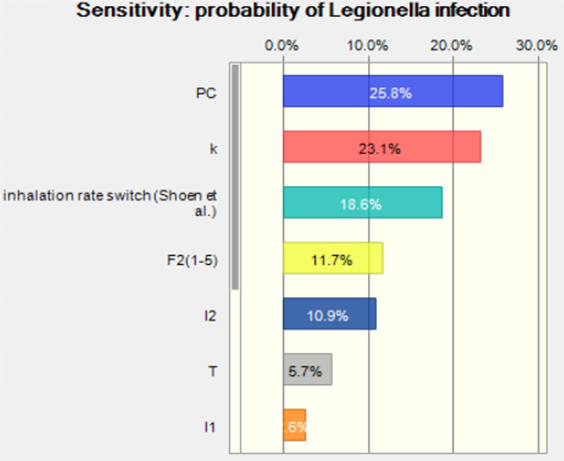
Figure 5. Sensitivity analysis for probability of Legionella infection
The Monte-Carlo model comparing Lp risk from different sources produced the following daily risk results, presented in Figure 6 in terms of boxplot data.
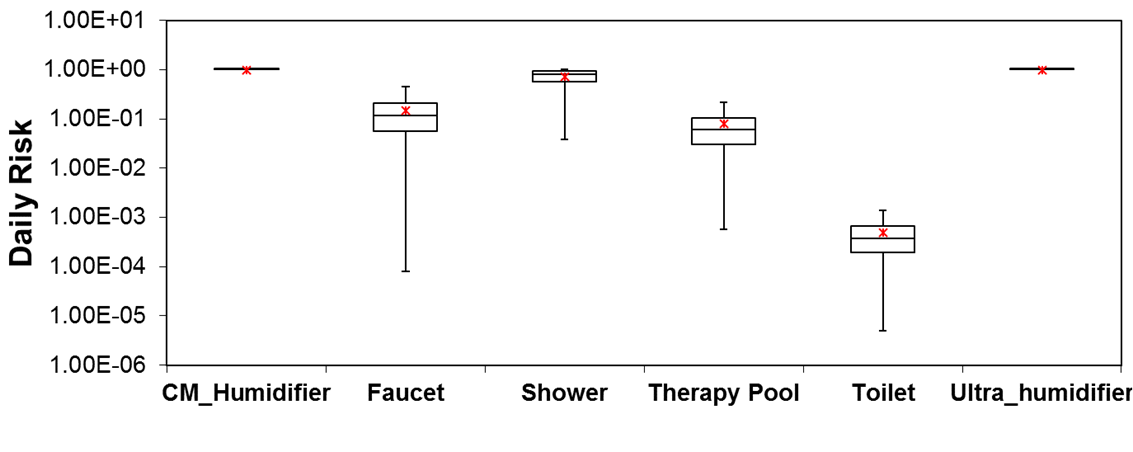
Figure 6. Daily risk of infection from different sources
From the boxplot data shown above, it is clear that humidifiers had maximum daily risk attributed primarily to high exposure times. The risk from humidifiers assumes that people do not use filtered or boiled water for humidifier purposes. Apart from the humidifier, shower was a significant source of risk, possibly due to higher partition coefficient values. Faucet and therapy pools were ranked (nearly equal) after the shower and had much higher risk values than toilet risk exposure. Annual risk analyses will need to be conducted to get better contextual estimates and to compare with EPA recommended limit of 10-4.
Sensitivity analysis of the data (shown in Figure 7 as a heat map) revealed that the water concentration of Lp was the most significant parameter for all sources. Only for cool mist humidifier and ultra-humidifier, the exposure time sensitivity was closer to Lp water concentration. Inhalation rate ranked lowest for sensitivity.
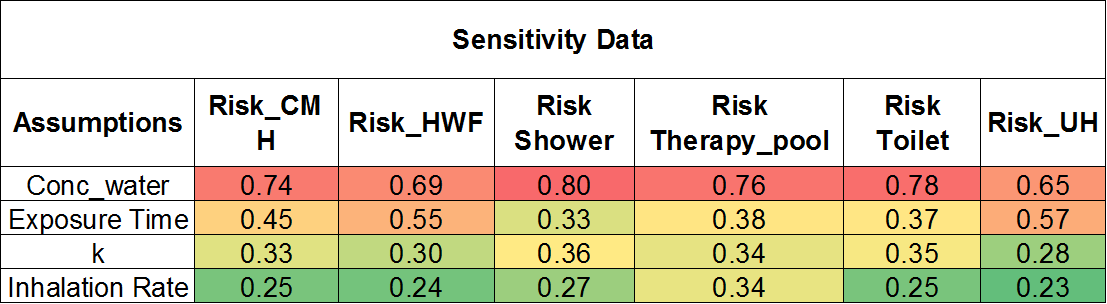
Figure 7. Sensitivity analysis of the daily risk
Risk Management & Communication
Risk Management Strategies and Recommendations
Given the uncertainties associated with standard CFU counts of Legionellae on selective media or qPCR estimates of total Legionellae, eliminating conditions suitable for Legionella growth has been recognized as a good control strategy (Buse et al.[8]). Also, Thermal Eradication Procedure (TEP) indicated some degree of success in regards to controlling Legionella concentrations in four homes (Stout and Muder[32]). TEP involves raising the hot water temperature in the hot water tank to 140°F [60°C] and flushing each outlet for 20 to 30 minutes with the super-heated water. After the procedure the temperature was returned to the previous setting. The reduction in Legionella percent positivity of water outlets for each home was 75% to 25%, 100% to 0%, 100% to 0%, and 100% to 0%, respectively.
A thermal disinfection experiment showed that Legionella concentrations in water were reduced by 22 to 44 times in samples obtained from water at 58 °C compared to samples taken from water at 39°C (control) (Rhoads et al.[33]). We applied these values to our model and compared with one of the hospitals in the Schwake et al.[2]. The probability of Legionella infection reduced from a maximum value of 0.47 to 0.04.
Thermal disinfection method is relatively inexpensive and could be applied in Flint, especially given the socio-economic status of a good proportion of the residents who may not be able to afford more expensive control measures. We recommend setting the water heater temperatures to at least 60 degrees celsius, maintaining that temperature for 60 minutes and flushing all outlets in the home for 30 minutes immediately afterward.
Risk Communication Strategy
- Streamline Information Dissemination system
- Rebuild trust in the Community
- Engage the Community (Town hall meetings)
- Leverage Social Media to convey information
- Sustain Feedback Channels
References
- Citekey 1594 not found
- Citekey 1595 not found
- Citekey 1600 not found
- Citekey 1601 not found
- Citekey 1602 not found
- Citekey 1603 not found
- Citekey 1604 not found
- Citekey 1605 not found
- Citekey 1634 not found
- Citekey 1635 not found
- Citekey 1636 not found
- Citekey 1637 not found
- Citekey 1638 not found
- Citekey 1639 not found
- Citekey 1640 not found
- Citekey 1641 not found
- Citekey 1642 not found
- Citekey 1643 not found
- Citekey 1644 not found
- Citekey 1645 not found
- Citekey 1646 not found
- Citekey 1647 not found
- Citekey 1648 not found
- Citekey 1649 not found
- Citekey 1651 not found
- Citekey 1652 not found
- Citekey 1596 not found
- Citekey 1597 not found
- Citekey 1599 not found
- Citekey 1653 not found
- Citekey 1598 not found
- Citekey 1654 not found
- Citekey 1655 not found