Risk Communication
It is unclear how to reconcile public and expert views of risk. This is the prescriptive issue of “How should one give advice to the public about how to deal with difficult technological risk issues?” Clearly a first step is recognizing that the public will view risks differently from how experts view risks, and recognizing that the public’s broad, multi-attribute view of risk is in many ways legitimate. One should not expect the public to drop their risk preferences in favor of those of expert assessors. Nevertheless there are times when experts really do have important information which could help inform public preferences and actions regarding risks.
The 'mental models' risk communication framework is a method to target risk communication efforts at the key knowledge deficiencies in the public.[1] A risk communication effort should not waste time telling people what they already know. Instead it should empirically determine what people know and do not know and direct risk communication efforts towards the latter.
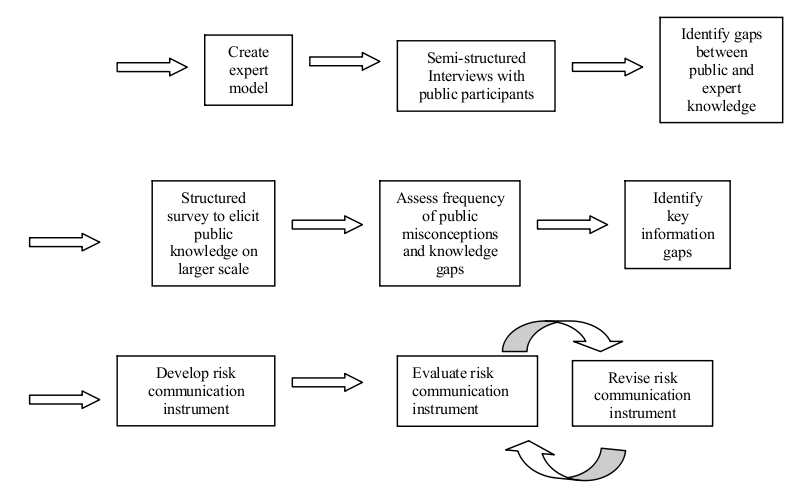
The 'mental models' risk communication framework.
First, expert knowledge is compiled into an expert model of the risk through a review of the literature and interviews with subject matter experts. Then a series of semi-structured interviews are conducted with members of the public. The interviewer first asks the subject to describe his or her knowledge about the particular risk. The interviewer then asks follow-up questions aimed at eliciting the subjects’ causal understanding of the process. Interview transcripts are analyzed to identify deviations between the expert and public models. The semi-structured interviews are an exploratory research technique to aid in the development of hypotheses as to what are common and important deviations between public and expert understanding. However, they are very time-consuming which limits the number that can be performed. Because of the small sample size, one cannot conclude definitively how frequently a given misconception occurs among members of the public. For this reason the semi-structured interviews are followed by a more structured elicitation of public knowledge, often in the form of a written survey. This survey questions respondents about particular misconceptions or information gaps which are hypothesized to be prevalent in the subject population, based on the results of the semi-structured interviews.
After the structured survey is completed, the data are analyzed to assess the frequency of particular misconceptions and gaps in the subject population. One must determine whether these gaps occur frequently enough in the subject population to merit their inclusion in a risk communication instrument. One must consider not only frequency of occurrence of different information gaps, but also how frequently this information gap would lead to an incorrect decision. Some knowledge deficiencies may be more or less harmless, while other information deficiencies can lead to incorrect decisions and for this reason should receive priority in risk communication efforts. Once the key information gaps to be addressed have been identified, information designed to address these knowledge deficiencies is put into a risk communication instrument, such as a pamphlet or video. The next step in the mental models framework is the evaluation of this risk communication instrument. This may be done through a simple pretest and posttest in which subjects’ knowledge is assessed before they are exposed to the instrument and after they are exposed to the instrument. If any problems are identified with the instrument, then the instrument should be revised to address these problems, and the revised instrument should be we evaluated empirically again. This process of revision and reevaluation is repeated as often as necessary in order to develop a satisfactory risk communication instrument.
While the Mental Models risk communication framework has been effectively applied to several different risks, this is not to say that there is a simple algorithm for how to undertake risk communication. Often decisions about risk involve difficult tradeoffs and serious conflicts between expert and public valuations of risk. The simple provision of additional information will not necessarily resolve these conflicts even if the information that is to be provided has been precisely targeted at key knowledge gaps by the Mental Models framework. While there is no simple algorithm for how to deal with difficult risk communication issues, there are at least some guidelines that have been learned from past experience. A review [2] how such guidelines have evolved over the course of twenty years and summarized eight stages in the historical evolution of risk communication:
- All we need to do is get the numbers right
- All we have to do is tell them the numbers
- All we have to do is explain what we mean by the numbers
- All we have to do is show them that they’ve accepted similar risks in the past
- All we have to do is show them that it’s a good deal for them
- All we have to do is treat them with respect
- All we have to do is make them partners
- All of the above
This process evolved from one that did not involve the public, to one that involved the public as passive receivers of risk information, and finally to one in which the public is a partner in the risk management process. While one cannot formulate universally effective guidelines for risk communication, the best chances for success lie in adopting an attitude of respect for the public’s point of view and ongoing engagement with the public. This engagement should seek to instruct the public and improve their knowledge of the issue and also to learn from the public what their oncerns are and what their values are.
Risk Perception
It became apparent fairly soon after a quantitative science of risk assessment was developed that experts and the public perceive risks in different ways. Cognitive psychologists investigating these discrepancies developed a body of knowledge related to how both experts and the public perceive risk (Slovic 1987, Slovic et al. 1980 [3], Slovic et al. 2004 [4]). It was found that expert assessments of risk were driven largely by the expected number of fatalities. On the other hand, the public’s perception of risk was actually richer in that it was based on a far broader range of factors. For example, public perception of risk is driven by not only expected fatalities but also factors such as the newness of the technology, the threat that the technology might present to future generations, the dread that the technology inspires on a gut level, the uncertainty associated with the risk, whether exposure to the risk is voluntary or involuntary, and many other attributes. In fact, responses to a very wide range of questions can be correlated to the public’s perception of risk. However, many of these questions would touch on the same underlying factor. For example, the gut level dread inspired by a risk and its catastrophic potential would likely be highly correlated, since both stem from the possibility that a technology might have the potential to produce massive numbers of casualties in the event of a malfunction. A statistical technique called factor analysis can be used to interpret highly correlated responses on surveys in terms of a much smaller number of underlying factors.
In the case of risk perception, three underlying factors have commonly been identified. The first is usually labeled “dread” and encompasses factors such as the gut-level, emotional reaction inspired by the risk, the threat the risk presents to future generations, and the catastrophic potential of the risk (i.e., potential to produce mass casualties). The second factor is “familiarity”. This includes whether the risk is old or new, whether the risk is well understood by science or poorly understood by science, and whether it is something the public deals with on a daily basis or that is less commonly encountered by the public. The third common factor is the number of people exposed to the risk. Scores on each of these factors can be computed, and the location of a particular risk in this factor space identified. Figure 1 [3] is an example of such a plot with the x-axis showing the factors score on the dread factor, and the y-axis showing the factor score on the familiarity factor.
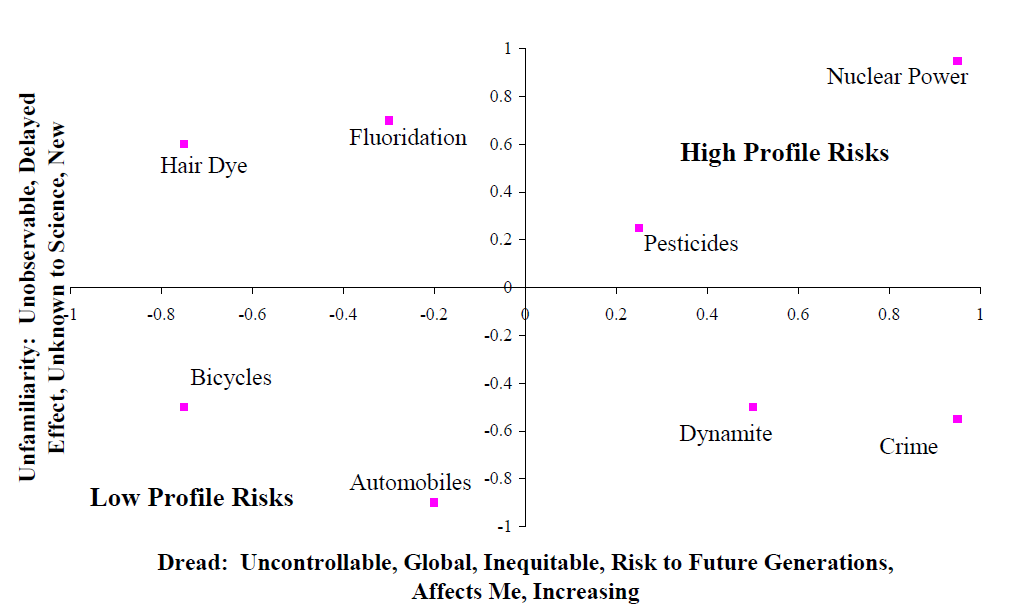
Dread and familiarity.
Nuclear power is notable as it occupies the space at the extreme upper right hand quadrant of the factor space. As nuclear power is considered both unfamiliar and dread, it is a high-profile risk that elicits concern on the part of the public. In general risks in the upper right hand corner of Figure 1 are higher profile risks, which will attract more public attention. Conversely risks in the lower left hand quadrant scored low on both of these two factors and will tend to attract less public attention and concern. While this conceptual framework is very helpful in describing how the public response to various risks, its ability as a predictive framework to anticipate how the public will react to any particular risk has not been established.
It is also worth noting how this body of literature is often summarized in an overly simplistic fashion. In some cases public perception of risk may be described as being driven solely by “dread”. In other cases, the distinction between voluntary and involuntary risks may be presented as the only distinction that the public makes. It is true that emotional factors, such as “dread” impact public perception of risk, and it is also true that the public tolerates higher levels of risk for voluntary activities such as paragliding, than for involuntary activities, such as living in an area where a nuclear power plant is proposed to be located. Nevertheless, one should be mindful that public perception is driven not just by these two factors of dread and voluntariness, but by a very wide variety of other factors as well.
A second framework for understanding the public perception of risk is based on understanding the distinction between analytical and affective thought. Analytical thought is what the experts do in the formal process of risk assessment. It consists of applying systematic methods and mathematical models to developing quantitative estimates of risk. In contrast, affective thought is an emotional, gut-level response. While the analytical approaches to risk assessment are considered more precise and accurate than affective approaches, affective methods can actually be seen as necessary shortcuts for coping with the large number of risks we face given limited cognitive resources. Affective responses can be seen as a sort of heuristic approach to risk assessment.
As an example, one can consider how the two different systems can be applied to the same risk problem. An individual considering buying an automobile might compare the fatality risks and costs of different models. The risk reduction could be converted to an equivalent monetary value using benchmark values for rate of investment to avert fatal risk. The individual could then select the model with the lowest sum of monetized risk and purchasing price. Another individual might lack either the training or necessary information to conduct this quantitative assessment and might instead simply buy a vehicle that is rated as highly safe by a trusted consumer watchdog group.
Figure 2 shows a framework [4] for understanding how affective assessments function. An overall assessment is first developed which then impacts the perceived costs and benefits of the risk. For example, nuclear power may have a highly negative affective response due to concerns over a Chernobyl-scale release of radioactivity. This negative affect will influence assessments of the benefits of nuclear power to be low and costs to be high. In contrast, in the analytical system the risk of a catastrophic failure would be weighted by its probability of occurrence (presumably very low). In addition the costs and benefits are typically separate calculations.
While affective thinking is a necessary shortcut to enable us to live our daily lives, it also has real weaknesses. For example, cigarette smoking may be associated with positive affect (peer acceptance, effects of nicotine, etc.) which leads individuals to downplay risk estimates in their decision to smoke [4].
Economics
Cost of illness
Cost of illness is defined as the value of resources that are expended or foregone due to a a health problem. It includes direct costs for health care, indirect costs such as lost productivity by the patient, and intangible costs, such as for pain and suffering.[1]
The US EPA has published the 'Cost of Illness Handbook' to give estimates of the lower bound cost of medical care for a number of environmentally-related illnesses.[2]
Value of a Statistical Life (VSL)

VSLs used for regulations between 1985 and 2000 by various U.S. agencies [5]
Managing ones own risk often involves a tradeoff between money and an increase or decrease in risk. For example, a person may purchase a more expensive household cleaner if it is more effective at killing household bacteria. The extra cost is a tradeoff for a lower risk of infection by household bacteria. Economists can use this information on a much larger scale to asses the costs and benefits of risk reduction efforts. The value of a statistical life (VSL) is a dollar value associated with one single human life. A VSL can be used to determine whether or not it is beneficial to implement new policies that may lower a certain risk.
There are several methods of determining VSL, which depend on the context in which it is being used. For example, the VSL for a group of laborers may be determined by the wage-risk tradeoffs the workers take, like receiving extra compensation for a higher risk job. If analyzing a new public health policy for a government however, the VSL may be determined by the cost-benefit analysis associated with the risk that new policy seeks to reduce.
Regardless of context, the VSL is always a measurement of the cost of reducing the number of deaths (or saving more lives). A 2003 study by Viscusi and Aldy [5] reviews over 100 studies estimating risk premiums.
Health-adjusted life-years (HALYs)
When considering the public health impact of widely differing diseases, conditions, and losses of life, it is useful to use summary health-adjusted life-year measures to compare them. They can also be used as an effectiveness measure: if funding program X gains more HALYs per dollar than funding program Y, then we should prefer program X, even if they address drastically different health problems (e.g., cancer survival vs. workplace amputations). HALYs give a year of healthy life by 1 person a value of 1. Various health problems are assigned weights from 0 to 1 according to their severity. There are many different sets of weights that can be used, and their derivation and use are sometimes controversial [6].
There are two main types of HALYs: quality-adjusted life-years (QALYs) and disability-adjusted life-years (DALYs).
QALYs were developed in the 1960s to facilitate cost-effectiveness analysis. They consider general attributes of health rather than specific diseases. QALY weights use 1 for perfect health and 0 for death, and are sometimes referred to as 'health-related quality of life' (HRQL) weights [6].
DALYs were designed by the World Health Organization and the World Bank to describe the burden of disease in different countries and regions worldwide [7]. Unlike QALYs, DALYs explicitly consider an extremely wide variety of different diseases. However, DALYs do not account for comorbid conditions, partly because DALYs are meant more for developing countries where comorbidities are less common. DALY weights resemble the opposite of QALY weights; a weight of 0 is perfect health and a weight of 1 is death [6].
DALY weights are available online from the World Health Organization.[1] There are several different sets of HRQL weights or scores that are used for QALYS, such as the Quality of Well-Being scale [8], the Health Utilities Indexes [9], and others [6].
Discounting
A general concept in economics is that a dollar received in the future is less valuable than a dollar received immediately. This concept is sometimes also extended to HALYs. For example, if someone dies at age 30 but was expected to live until age 70, that could be considered 40 years of life lost without discounting. However, the years of life lost would be less under discounting, according to the discount rate (originally 3% per year for DALYs [7]).
Compliance
A risk analysis may suggest particular actions or interventions that should be taken to reduce risk. Actually taking these actions is termed 'compliance' (also known as 'adherence'). Noncompliance is common, even in situations where the consequences of noncompliance appear serious. For example, 56% of workers who were exposed to anthrax in 2001 stated that they did not complete the recommended 60 days of antibiotic prophylaxis [10]. Measuring compliance accurately is difficult, particularly because people may not answer truthfully when asked about their behavior. Partly for this reason, tuberculosis is often treated by directly observing each patient swallowing each dose of medication (Directly Observed Therapy [DOT]); tuberculosis treatment is long-term and the consequences of treatment failure are serious [11].
Non-compliance is not necessarily the 'fault' of the person who did not comply [12]. Many factors affect compliance, including patient perception of risks and benefits with and without an intervention, ability to comply (physical or economic), trust/distrust of the agency recommending an intervention, and social support for the intervention. If high compliance is desired, the intervention must be designed and communicated so as to be easy to apply by a wide variety of people.
Effective promotion of compliance requires effective risk communication.
Cultural Aspects
People perceive risks and act to influence risks in different ways, depending on their culture. Cultural differences can be seen at many different scales; countries, ethnic groups, organizations, and small groups. Furthermore, individual people may behave differently depending on the cultural group they are part of at a particular time. Since people sharing a particular group's culture are likely to be more similar to each other than to others outside the group, it is reasonable to expect cultures to behave differently regarding issues of risk.
A popular paradigm for classifying cultures is to place them in a space defined by two axes, representing the extent to which people associate and identify with a particular group (often abbreviated 'group' or described as 'Who am I?') and the amount of regulation or prescription that people are subjected to (often abbreviated 'grid' or described as 'What can I do?') [13]. This is sometimes called 'grid-group theory' or 'cultural theory', and it leads to four main cultural types [14], as shown in the figure to the right. The types are general classifications, and continuums exist along the axes.
Different cultural types tend to view nature in different ways, which influences their views of risk. Isolated or fatalist cultures feel that they have little control over an unpredictable environment and cannot effectively act to mitigate risks. Hierarchichal cultures use regulation to reduce risks to nature and society. Individualist cultures have a more tolerant attitude toward risks, partly because they consider nature to be extremely stable. Finally, factionalist cultures can consider risks to be more serious than other cultures, partly due to distrust of information from outside their particular faction or sect.
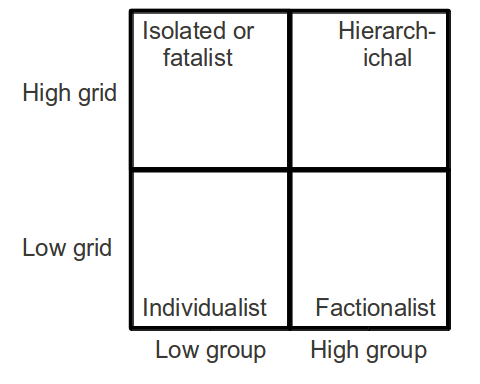
The four main categories of culture, according to grid-group theory. Many different labels exist for these categories [14].
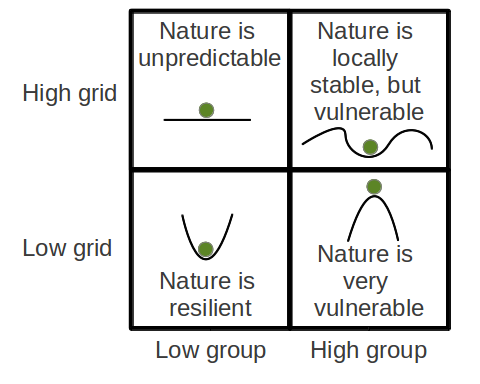
Views of nature, according to grid-group theory [13].
References
- (2002). Risk communication: A mental models approach.
- (1995). Risk perception and communication unplugged: twenty years of process. Risk analysis: an official publication of the Society for Risk Analysis. 15, 2.
- (1980). Understanding Perceived Risk. (Schwing, R.., & Albers W., Ed.).Societal risk assessment: how safe is safe enough? New York:.
- (2004). Risk as analysis and risk as feelings: some thoughts about affect, reason, risk, and rationality. Risk analysis: an official publication of the Society for Risk Analysis. 24, 2.
- (2003). The value of a statistical life: A critical review of market estimates throughout the world. Journal of Risk and Uncertainty. 27, 1.
- (2002). HALYS and QALYS and DALYS, Oh My: similarities and differences in summary measures of population Health. Annual review of public health. 23, 115.
- (1996). The Global Burden of Disease: a Comprehensive Assessment of Mortality and Disability from Diseases, Injuries, and Risk Factors in 1990 and Projected to 2020. (Cjl, M., & AD L., Ed.).
- (1988). A general health policy model: update and applications. Health services research. 23, 203-235.
- (2003). The Health Utilities Index (HUI): concepts, measurement properties and applications. Health and Quality of Life Outcomes. 1, 54.
- (2002). Antimicrobial postexposure prophylaxis for anthrax: adverse events and adherence. Emerging infectious diseases. 8, 10.
- (2010). Treatment of tuberculosis guidelines.
- (2003). Adherence to long-term therapies: evidence for action.
- (1999). Cultural theory and risk: a review. Health, risk & society. 1, 71-90.
- (1999). Grid-group cultural theory: an introduction. GeoJournal.. 47, 3.