General overview
Various species of Cryptosporidium infect most vertebrates. C. parvum infects cattle but can also infect humans; C. hominis appears to be restricted to humans, and began to be recognized in the early 2000s (Hunter 2005) [1]. The oocysts are the infective stage and are about 5 microns in size; they are excreted in feces and are transmitted to new hosts by the fecal-oral route. They are highly resistant to chlorine, but are vulnerable to ultraviolet light disinfection (AWWA 1999) [2]. The durability and infectiousness of the oocysts, as well as their documented ability to cause large outbreaks (Mac Kenzie et al., 1994) [3], means that control of Cryptosporidium is very important for drinking water treatment. Water treatment utilities should consider all surface water to be contaminated with oocysts (AWWA 1999) [2]. Effective control of Cryptosporidium is generally achieved in drinking water treatment through filtration yielding nonturbid water (<= 0.1 nephelometric turbidity unit) (AWWA 1999).
Cryptosporidiosis is a disease described by a self-limited watery diarrhea with an incubation period of 3 to 7 days (Miliotis & Bier 2003) [4]. Asymptomatic infections are also common in apparently healthy children and adults (Blaser 2002) [5]. However, the disease is particularly dangerous to people with HIV/AIDS because there is no effective treatment (Miliotis & Bier 2003) [4]. This can lead to lethal infections, or chronic disease lasting months or years that severely damages the gut.
Summary of Data
Chappell et al. (2006) [6] describe a feeding study of C. hominis in adult humans. Although infection and diarrhea were both measured, only diarrhea demonstrated an approximately increasing response with dose. This is in contrast to the subsequent model fits for C. parvum, all of which use infection as the response.
References
- (2005). The zoonotic transmission of Giardia and Cryptosporidium. International journal for parasitology. 35, 1181–1190.
- (1999). Waterborne pathogens: manual of water supply practices.
- Citekey 1475 not found
- (2003). International handbook of foodborne pathogens. 125,
- (2003). Infections of the Gastrointestinal Tract. PRACTICAL GASTROENTEROLOGY. 63.
- (2006). Cryptosporidium Hominis: Experimental Challenge of Healthy Adults. The American Journal of Tropical Medicine and Hygiene. 75, 5.
| ID | # of Doses | Agent Strain | Dose Units | Host type | Μodel | Optimized parameters | Response type | Reference |
|---|---|---|---|---|---|---|---|---|
| 108 | 8 | Iowa strain | oocysts | human | exponential |
k = 4.19E-03 LD50/ID50 = 1.65E+02 |
infection | "The infectivity of Cryptosporidium parvum in healthy volunteers." The New England journal of medicine. 332 (1995): 13. |
| 139 | 8 | Iowa isolate | oocysts | human | exponential |
k = 5.26E-03 LD50/ID50 = 1.32E+02 |
infection | "Risk Assessment for Cryptosporidium: A Hierarchical Bayesian Analysis of Human Dose Response Data." Water Research. 35 (2001): 16. |
| 140 | 4 | TAMU isolate | oocysts | human | exponential |
k = 5.72E-02 LD50/ID50 = 1.21E+01 |
infection | "Risk Assessment for Cryptosporidium: A Hierarchical Bayesian Analysis of Human Dose Response Data." Water Research. 35 (2001): 16. |
| 141 | 4 | UCP isolate | oocysts | human | beta-Poisson |
a = 1.45E-01 LD50/ID50 = 1.79E+02 N50 = 1.79E+02 |
infection | "Immune response, ciprofloxacin activity, and gender differences after human experimental challenge by two strains of enterotoxigenic Escherichia coli." Infection and immunity. 75 (2007): 1. |
| 181 | 4 | *C. hominis*, TU502 | oocysts | human | beta-Poisson |
a = 2.7E-01 LD50/ID50 = 1.68E+01 N50 = 1.68E+01 |
diarrhea | "Infectivity of a Cryptosporidium parvum Isolate of Cervine Origin for Healthy Adults and Interferon-γ Knockout Mice." Journal of Infectious Diseases. 185 (2002): 9. |
| 183 | 4 | Moredun isolate | oocysts | human | beta-Poisson |
a = 1.14E-01 LD50/ID50 = 4.55E+02 N50 = 4.55E+02 |
infection | "Experimental Campylobacter jejuni Infection of Adult Mice." Infection and Immunity. 39 (1983): 2. |
k = 4.19E-03
LD50/ID50 = 1.65E+02
|
|
||||||||||||||||||||||
|
||||||||||||||||||||||||||||||||||||||
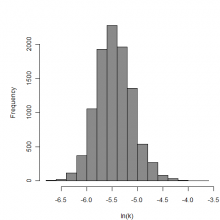
Parameter histogram for exponential model (uncertainty of the parameter)
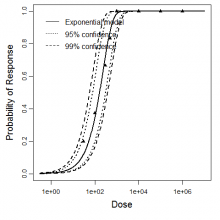
Exponential model plot, with confidence bounds around optimized model
References
k = 5.26E-03
LD50/ID50 = 1.32E+02
|
|
||||||||||||||||||||||
|
||||||||||||||||||||||||||||||||||||||

Parameter histogram for exponential model (uncertainty of the parameter)

Exponential model plot, with confidence bounds around optimized model
References
k = 5.72E-02
LD50/ID50 = 1.21E+01
|
|
||||||||||||||||||||||
|
||||||||||||||||||||||||||||||||||||||

Exponential model plot, with confidence bounds around optimized model

Parameter histogram for exponential model (uncertainty of the parameter)
References
LD50/ID50 = 1.79E+02
N50 = 1.79E+02
|
|
||||||||||||||||||||||
|
||||||||||||||||||||||||||||||

Parameter scatter plot for beta Poisson model ellipses signify the 0.9, 0.95 and 0.99 confidence of the parameters.

beta Poisson model plot, with confidence bounds around optimized model
References
LD50/ID50 = 1.68E+01
N50 = 1.68E+01
|
|
||||||||||||||||||||||
|
||||||||||||||||||||||||||||||

Parameter scatter plot for beta Poisson model ellipses signify the 0.9, 0.95 and 0.99 confidence of the parameters.

beta Poisson model plot, with confidence bounds around optimized model.
References
LD50/ID50 = 4.55E+02
N50 = 4.55E+02
|
|
||||||||||||||||||||||
|
||||||||||||||||||||||||||||||
Parameter scatter plot for beta Poisson model ellipses signify the 0.9, 0.95 and 0.99 confidence of the parameters.
beta Poisson model plot, with confidence bounds around optimized model.