General Overview
Echoviruses, a member of the enterovirus genus, is a type of RNA virus that were shown to be a frequent cause of simple febrile illnesses and aseptic meningitis. Most infected persons experience no symptoms or have self-limited disease. According to Modlin[1], deaths and other adverse consequences are rare and limited to patients with severe echovirus encephalitis or to persons with B cell-deficiency syndromes who develop persistent infection.
Human echoviral infection occurs via fecal-oral transmission. Infants are particularly susceptible to echovirus infection. Both vertical transmission from an infected mother and nosocomial transmission via hospital personnel appear to be important sources of infection for the neonate. Modlin[1] states that severe disease and death may follow the infection that occurs with the first 10-14 days of life.
Summary Data
Schiff et al.[2] challenged human volunteers lacking detectable serum antibody with echovirus-12 in chilled drinking water. The virus used in the study was originally recovered from a child with a clinical diagnosis of erythema infectiousum (fifth disease). The infection with echovirus-12 among volunteers was determined by intestinal shedding of virus and seroconversion.
Summary
The limited numbers of subjects under dose 33000 and 330000 might have contributed to their deviations from other dose groups and the unsuccessful fitting. By excluding these two outliner groups, significantly better fit was achieved (The reduction of deviance is substantially greater than the chi-square value at the degree of freedom of 2).
References
- (1986). Perinatal Echovirus Infection: Insights from a Literature Review of 61 Cases of SeriousInfection and 16 Outbreaks in Nurseries. Reviews of Infectious Diseases. 8, 918-926.
- (1984). Studies of echovirus-12 in volunteers: determination of minimal infectious dose and the effect of previous infection on infectious dose. The Journal of infectious diseases. 150, 6.
| ID | # of Doses | Agent Strain | Dose Units | Host type | Μodel | Optimized parameters | Response type | Reference |
|---|---|---|---|---|---|---|---|---|
| 112 | 6 | strain 12 | PFU | human | beta-Poisson |
a = 3.74E-01 LD50/ID50 = 1.01E+03 N50 = 1.01E+03 |
infection | "Pathogenesis of experimental Coxsackie virus infection." Archive of Virology. 7 (1963): 61-66. |
| 256 (excluding the outliers of exp 112) | 4 | strain 12 | PFU | human | beta-Poisson |
a = 1.06E+00 LD50/ID50 = 9.22E+02 N50 = 9.22E+02 |
infection | "Studies of echovirus-12 in volunteers: determination of minimal infectious dose and the effect of previous infection on infectious dose." The Journal of infectious diseases. 150 (1984): 6. |
LD50/ID50 = 1.01E+03
N50 = 1.01E+03
|
|
||||||||||||||||||||||
|
||||||||||||||||||||||||||||||
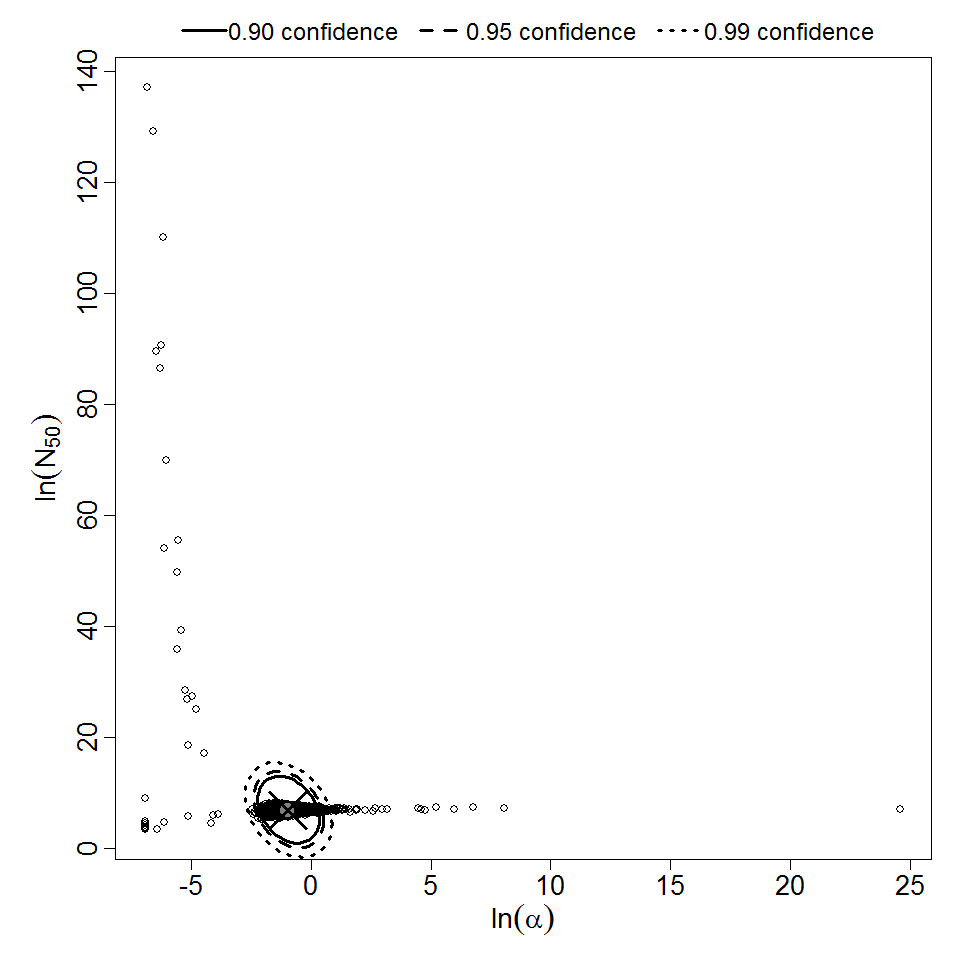
Parameter scatter plot for beta Poisson model ellipses signify the 0.9, 0.95 and 0.99 confidence of the parameters.
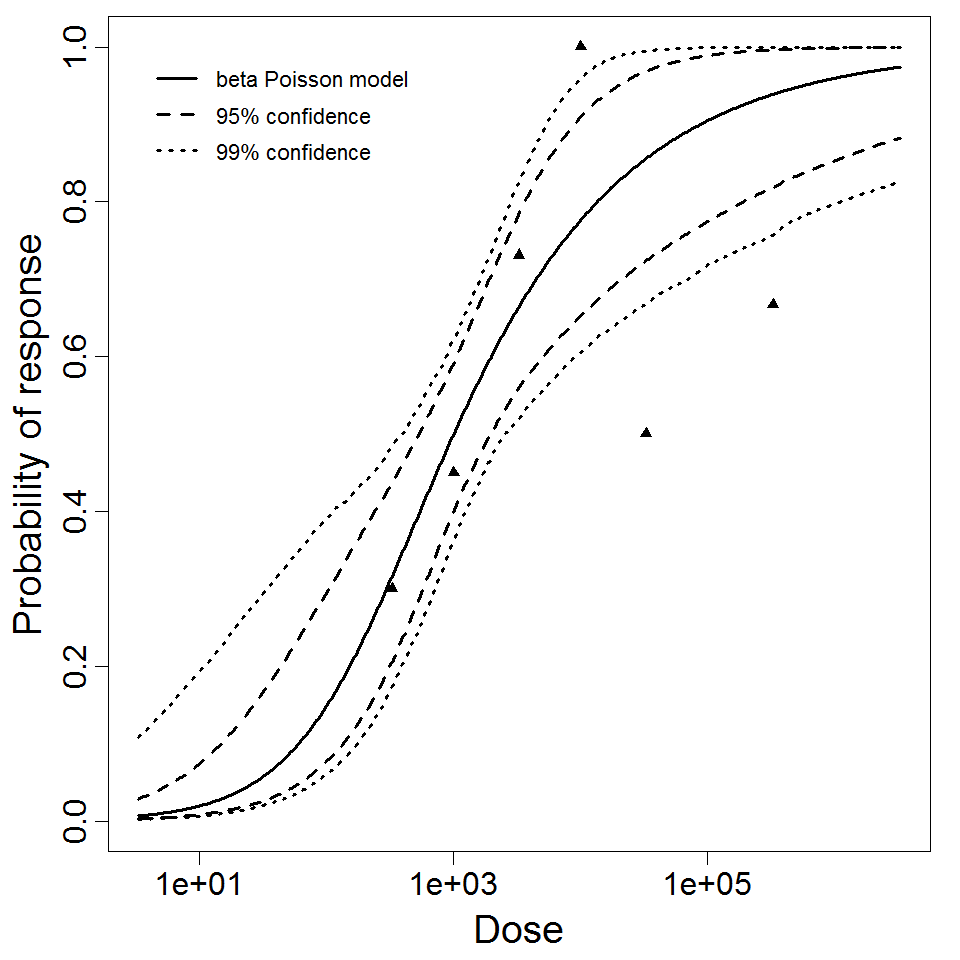
beta Poisson model plot, with confidence bounds around optimized model
References
LD50/ID50 = 9.22E+02
N50 = 9.22E+02
|
|
||||||||||||||||||||||
|
||||||||||||||||||||||||||||||
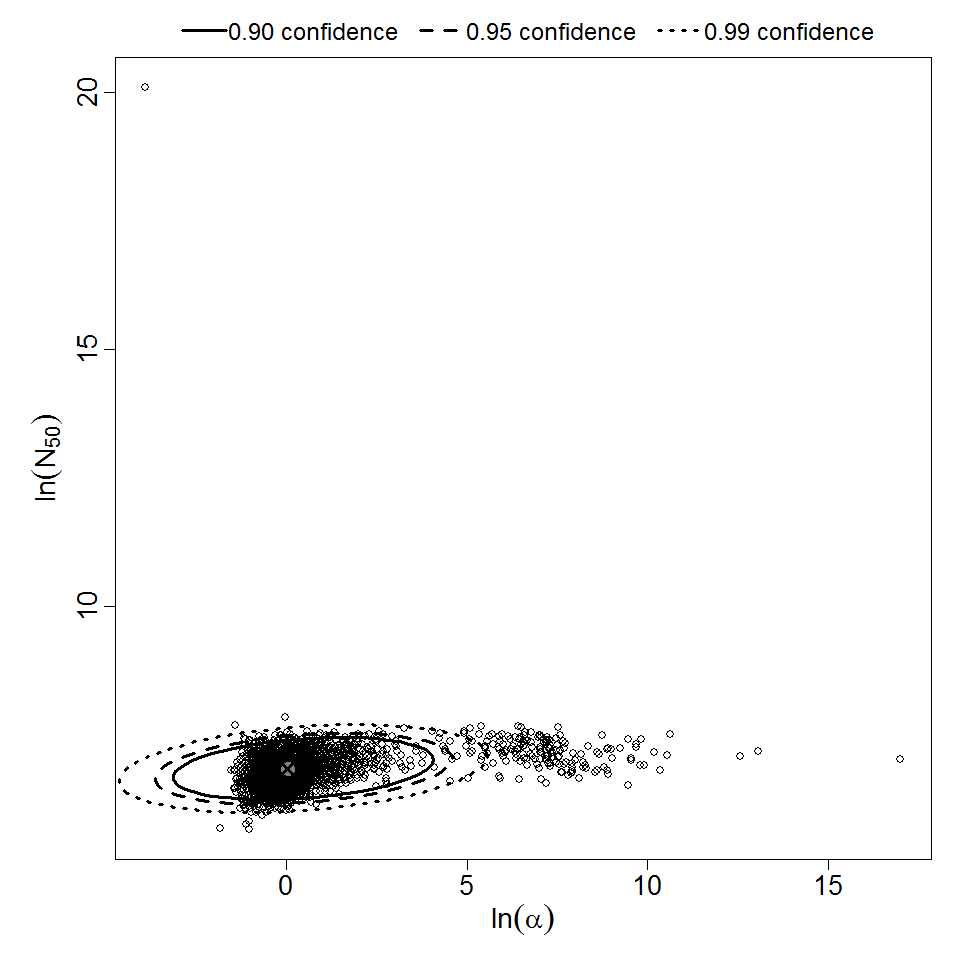
Parameter scatter plot for beta Poisson model ellipses signify the 0.9, 0.95 and 0.99 confidence of the parameters.
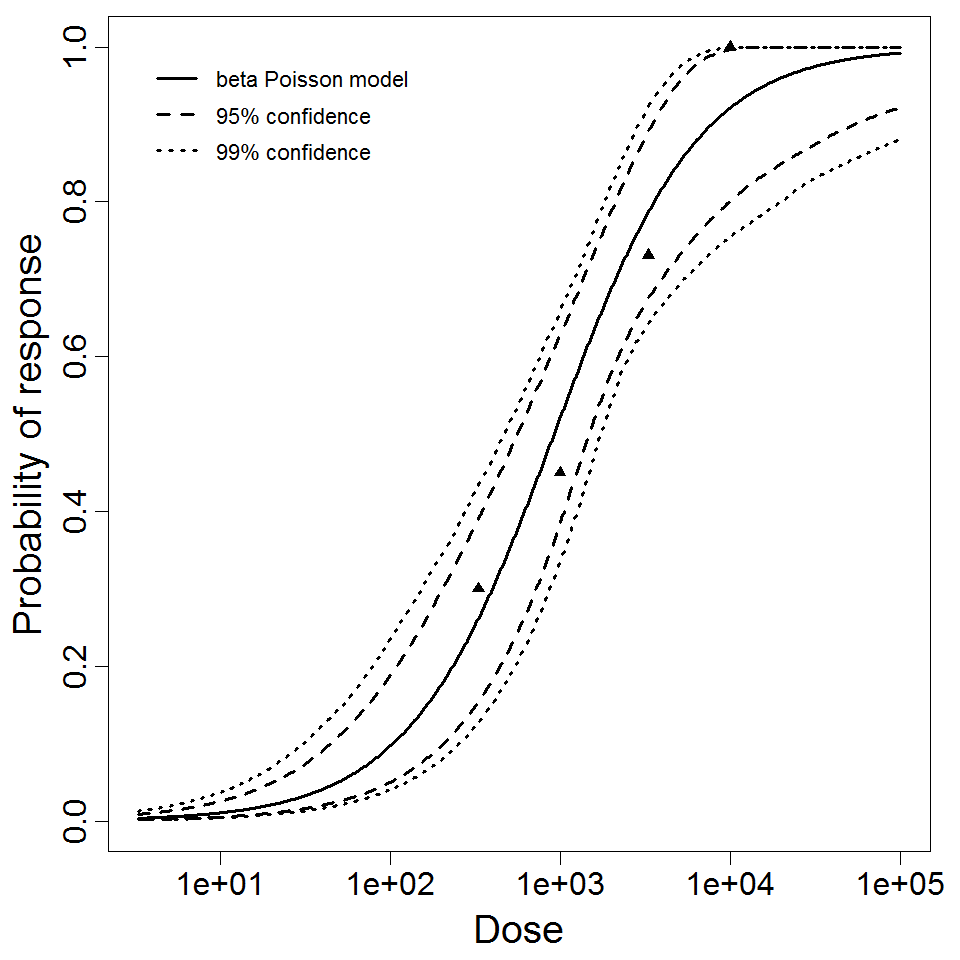
beta Poisson model plot, with confidence bounds around optimized model