Dose response data
| Dose |
Positive stool isolation |
No positive stool isolation |
Total |
| 1E+06 |
3 |
1 |
4 |
| 1E+08 |
4 |
1 |
5 |
| 1E+08 |
5 |
0 |
5 |
| 1E+08 |
5 |
0 |
5 |
| 1E+10 |
5 |
0 |
5 |
| 1E+10 |
5 |
0 |
5 |
| 1E+10 |
5 |
0 |
5 |
|
Goodness of fit and model selection
| Model |
Deviance |
Δ |
Degrees
of freedom |
χ20.95,1
p-value |
χ20.95,m-k
p-value |
| Exponential |
64.1 |
61.4 |
6 |
3.84
4.77e-15 |
12.6
6.67e-12 |
| Beta Poisson |
2.71 |
5 |
11.1
0.745 |
| Beta-Poisson fits better than exponential; cannot reject good fit for beta-Poisson. |
|
Optimized parameters for the beta-Poisson model, from 10000 bootstrap iterations
| Parameter |
MLE estimate |
Percentiles |
| 0.5% |
2.5% |
5% |
95% |
97.5% |
99.5% |
| α |
3.75E-01 |
1.29E-01 |
1.34E-01 |
1.34E-01 |
9.97E+00 |
9.97E+00 |
1.07E+01 |
| N50 |
1.78E+05 |
3.63E-01 |
3.63E-01 |
3.63E-01 |
2.46E+06 |
3.48E+06 |
6.09E+06 |
|
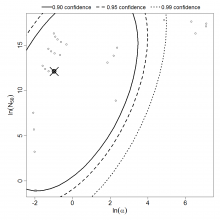
Parameter scatter plot for beta Poisson model ellipses signify the 0.9, 0.95 and 0.99 confidence of the parameters.
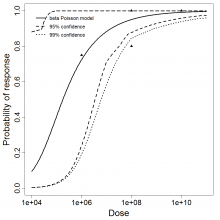
beta Poisson model plot, with confidence bounds around optimized model