Guinea pigs/ Philadelphia 1 strain data [1]
| Dose |
Infected |
Non-infected |
Total |
| 1 |
0 |
4 |
4 |
| 5 |
4 |
10 |
14 |
| 50 |
17 |
1 |
18 |
| 100 |
8 |
0 |
8 |
|
Goodness of fit and model selection
| Model |
Deviance |
Δ |
Degrees
of freedom |
χ20.95,1
p-value |
χ20.95,m-k
p-value |
| Exponential |
0.582 |
0.000479 |
3 |
3.84
0.983 |
7.81
0.9 |
| Beta Poisson |
0.582 |
2 |
5.99
0.748 |
| Exponential is preferred to beta-Poisson; cannot reject good fit for exponential. |
|
Optimized k parameter for the exponential model, from 10000 bootstrap iterations
| Parameter |
MLE estimate |
Percentiles |
| 0.5% |
2.5% |
5% |
95% |
97.5% |
99.5% |
| k |
5.99E-02 |
3.26E-02 |
3.90E-02 |
4.18E-02 |
1.11E-01 |
1.31E-01 |
1.57E-01 |
| ID50/LD50/ETC* |
1.16E+01 |
4.42E+00 |
5.28E+00 |
6.25E+00 |
1.66E+01 |
1.78E+01 |
2.13E+01 |
| *Not a parameter of the exponential model; however, it facilitates comparison with other models. |
|
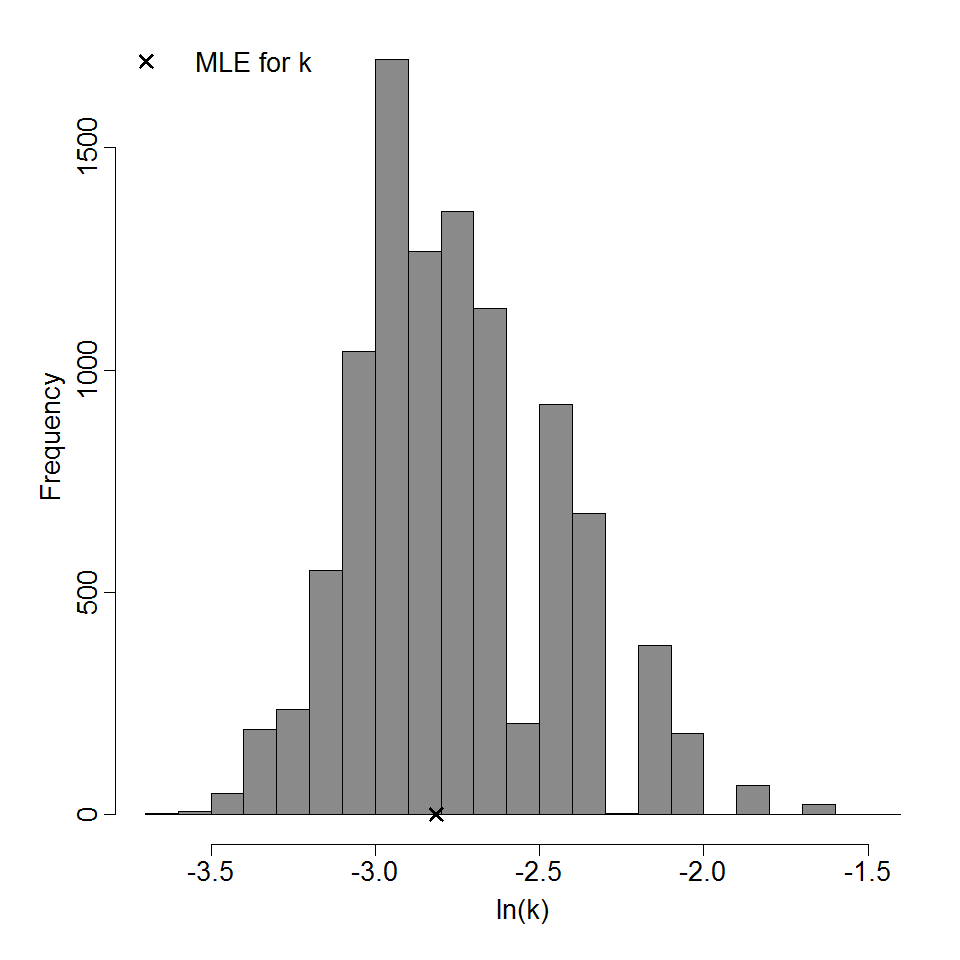
Parameter histogram for exponential model (uncertainty of the parameter)
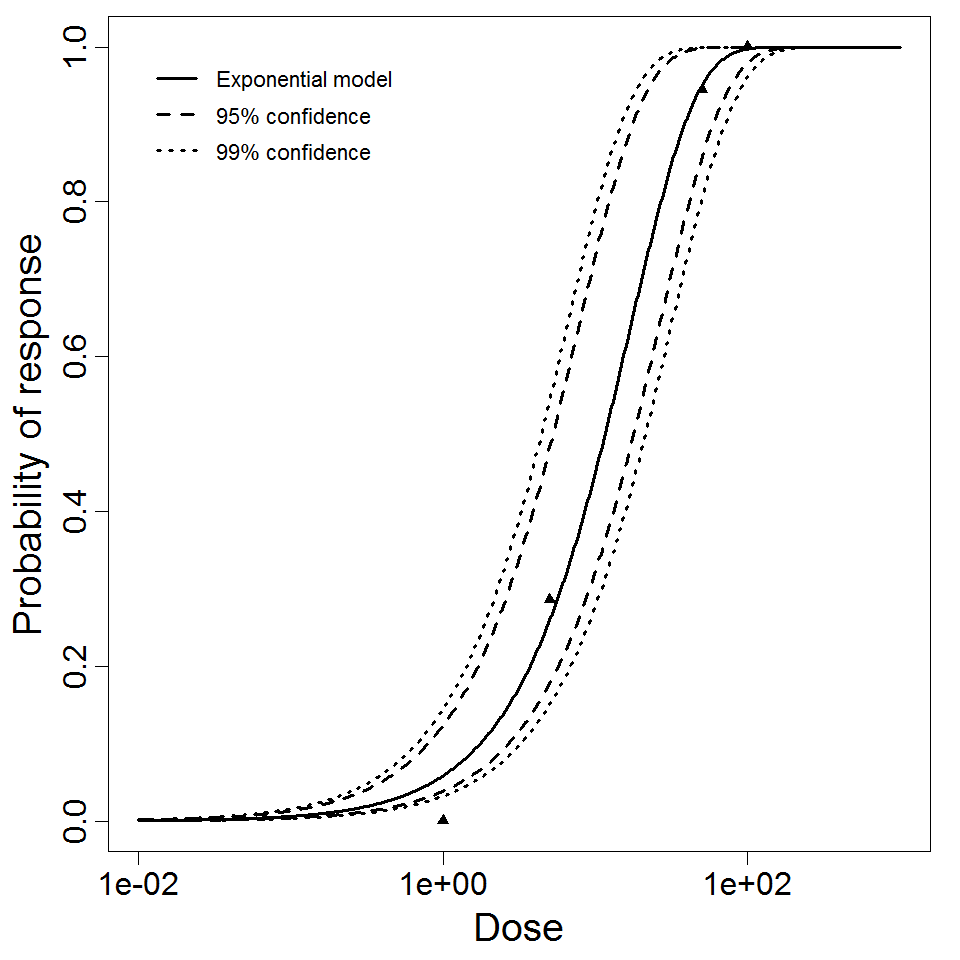
Exponential model plot, with confidence bounds around optimized model
References