mice (10day old, day2-21) / Pseudomonas aeruginosa [1]
| Dose |
Dead |
Survived |
Total |
| 2.5 |
0 |
10 |
10 |
| 25 |
0 |
16 |
16 |
| 250 |
0 |
15 |
15 |
| 2500 |
2 |
11 |
13 |
| 25000 |
13 |
3 |
16 |
| 250000 |
14 |
3 |
17 |
|
Goodness of fit and model selection
| Model |
Deviance |
Δ |
Degrees
of freedom |
χ20.95,1
p-value |
χ20.95,m-k
p-value |
| Exponential |
27.3
|
23.1 |
5 |
3.84
1.54e-06 |
11.1
5.01e-05 |
| Beta Poisson |
4.19
|
4 |
9.49
0.381 |
| Beta-Poisson fits better than exponential; cannot reject good fit for beta-Poisson. |
|
Optimized parameters for the beta-Poisson model, from 10000 bootstrap iterations
| Parameter |
MLE estimate |
Percentiles |
| 0.5% |
2.5% |
5% |
95% |
97.5% |
99.5% |
| α |
5.49E-01 |
2.38E-01 |
2.87E-01 |
3.17E-01 |
1.37E+00 |
1.13E+01 |
1.15E+04 |
| N50 |
1.13E+04 |
4.53E+03 |
5.70E+03 |
6.34E+03 |
2.17E+04 |
2.46E+04 |
3.39E+04 |
|
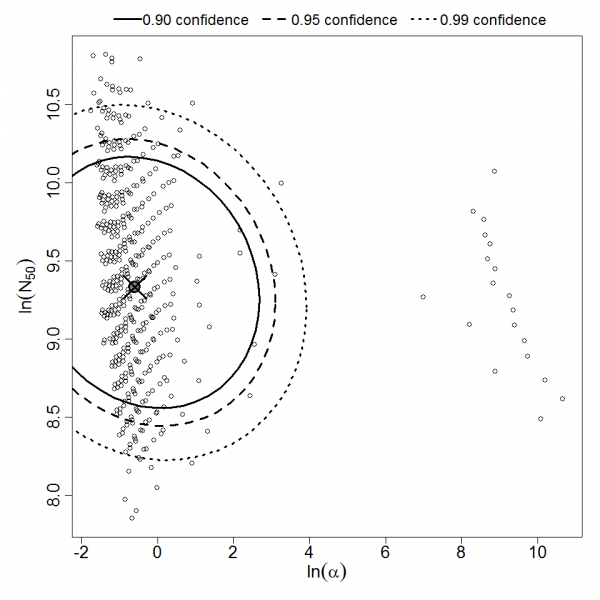
Parameter scatter plot for beta Poisson model ellipses signify the 0.9, 0.95 and 0.99 confidence of the parameters.
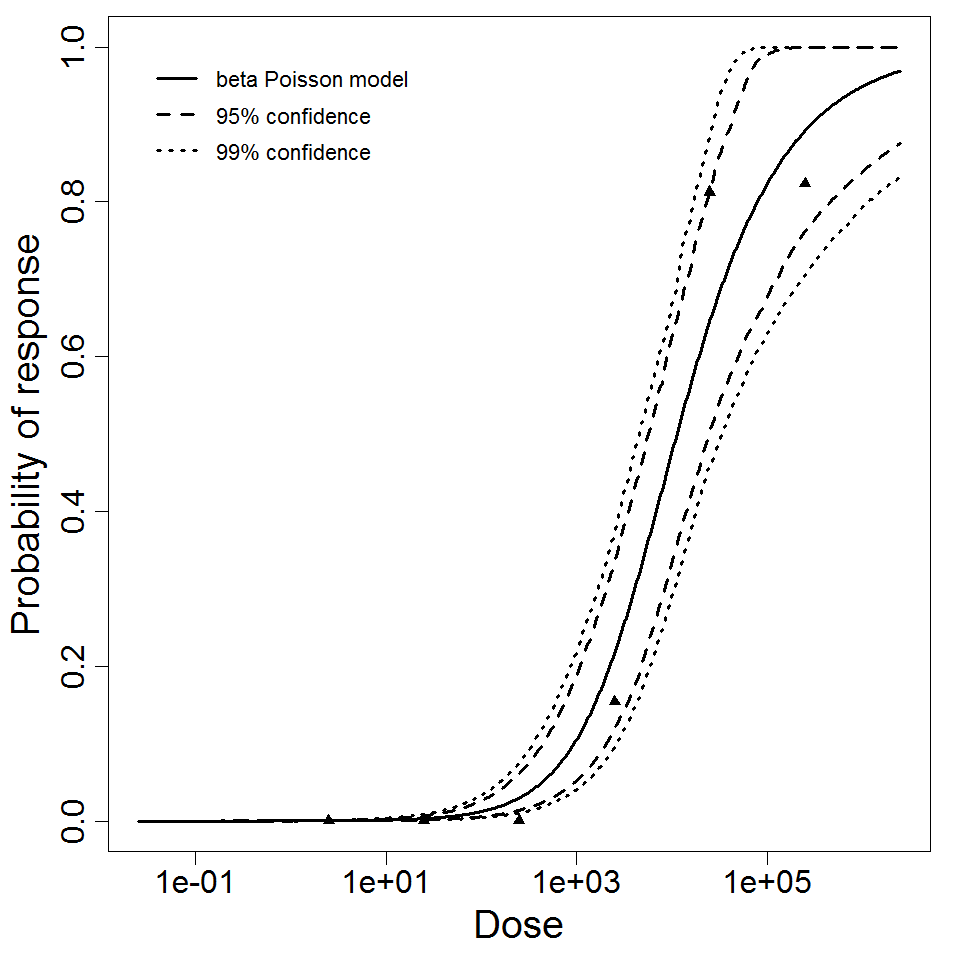
beta Poisson model plot, with confidence bounds around optimized model
References