Mice/ Salmonella strain 533 data [1]
| Dose |
Dead |
Survived |
Total |
| 603 |
6 |
36 |
42 |
| 1910 |
3 |
39 |
42 |
| 6030 |
7 |
35 |
42 |
| 19100 |
5 |
42 |
47 |
| 60300 |
6 |
34 |
40 |
| 191000 |
3 |
29 |
32 |
| 603000 |
6 |
20 |
26 |
| 1910000 |
7 |
7 |
14 |
| 6030000 |
7 |
5 |
12 |
| 1.91E+07 |
10 |
2 |
12 |
| 6.03E+07 |
13 |
0 |
13 |
|
Goodness of fit and model selection
| Model |
Deviance |
Δ |
Degrees
of freedom |
χ20.95,1
p-value |
χ20.95,m-k
p-value |
| Exponential |
193 |
146 |
10 |
3.84
0 |
18.3
0 |
| Beta Poisson |
47.5 |
9 |
16.9
3.22e-07 |
| Neither the exponential nor beta-Poisson fits well; beta-Poisson is less bad. |
|
Optimized parameters for the beta-Poisson model, from 10000 bootstrap iterations
| Parameter |
MLE estimate |
Percentiles |
| 0.5% |
2.5% |
5% |
95% |
97.5% |
99.5% |
| α |
6.21E-02 |
3.53E-02 |
4.06E-02 |
4.32E-02 |
1.09E-01 |
1.25E-01 |
1.80E-01 |
| N50 |
3.46E+07 |
9.76E+05 |
1.69E+06 |
2.40E+06 |
9.41E+08 |
2.13E+09 |
1.34E+10 |
|
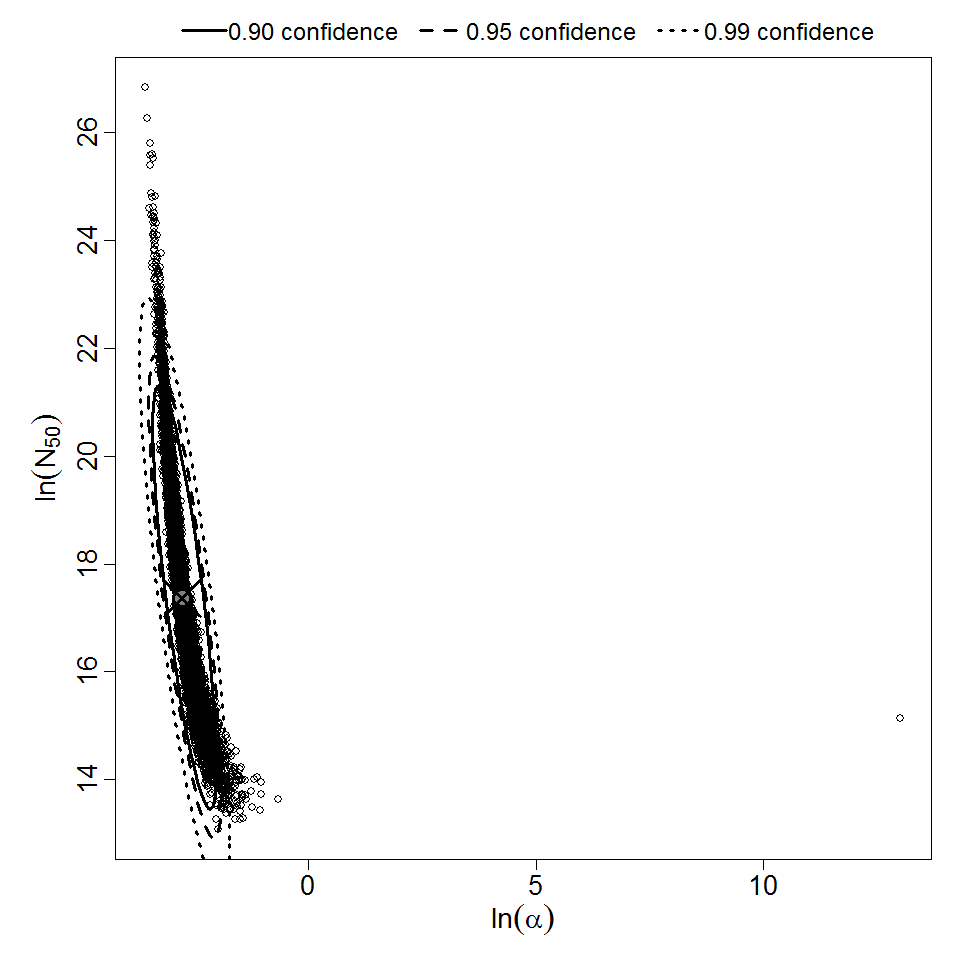
Parameter scatter plot for beta Poisson model ellipses signify the 0.9, 0.95 and 0.99 confidence of the parameters.
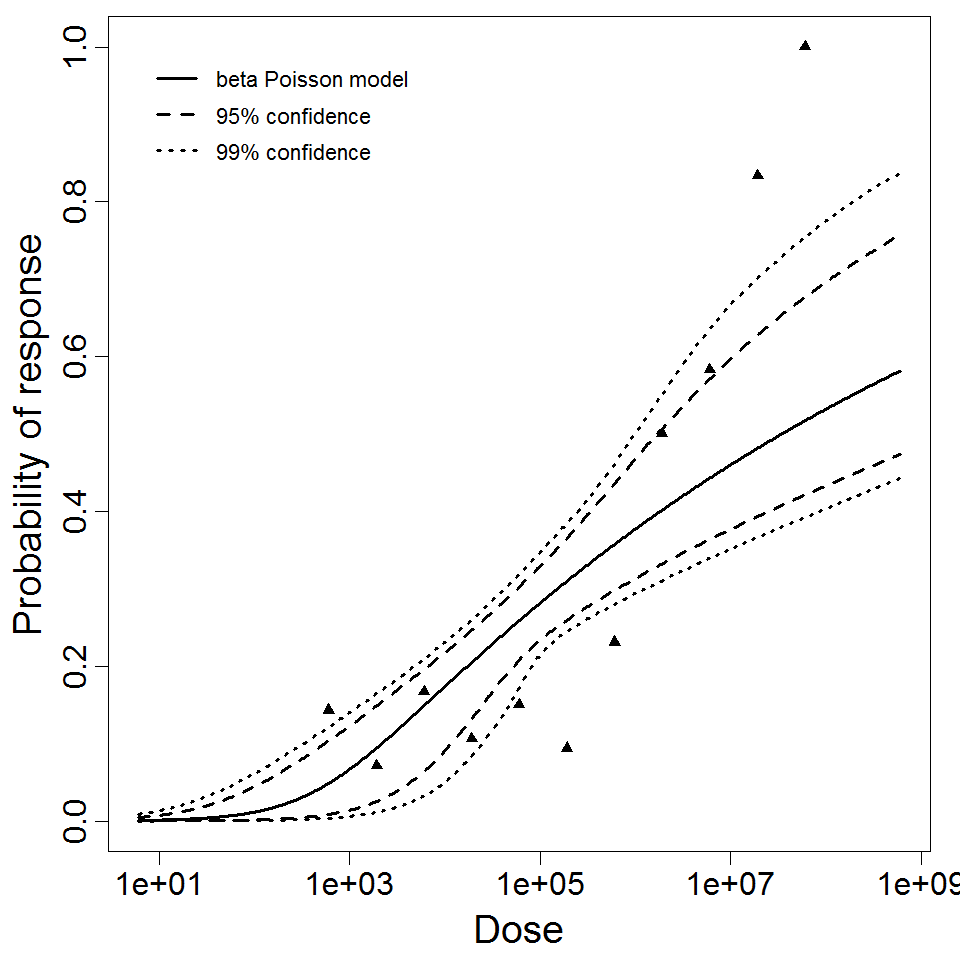
beta Poisson model plot, with confidence bounds around optimized model
References