General Overview
Yersinia pestis, the causative agent of plague, is a Gram-negative facultative anaerobic bipolar-staining bacillus bacterium belonging to the family Enterobacteriaceae. It has been classified as a Category A bioterrorism agent for public health preparedness by U.S. Centers for Disease Control and Prevention.
Plague is a dreadful disease of long standing. It has been the cause of three pandemics, and has led to the deaths of millions of people, the devastation of cities and villages, and the collapse of governments and civilizations. Small outbreaks of plague continue to occur throughout the world, and at least 2000 cases of plague are reported annually. At the present time, plague remains a serious problem for international public health, and its risk has been assessed using quantitative modeling approaches.Plague may be manifested in one of three forms: bubonic, pneumonic and septicemic.[1] Among the three forms of plague, pneumonic plague is particularly dangerous, with incubation period of 3 to 5 days and mortality rate approaching 100% unless antibiotic treatment is initiated within 24 hours of the onset of symptoms.
Plague is transmitted to humans from infected flees and rodents are reservoirs of the disease. While over 200 mammalian species have been reported to be naturally infected with Y. pestis, rodents are the most important hosts for plague.[2] Currently, most human plague cases in the world are classified as sylvatic plague, namely infection from rural wild animals such as mice, chipmunks, squirrels, gerbils, marmots, voles and rabbits [3]. Transmission between rodents is achieved by their associated fleas from the infected blood of the host. The organism is not transovarially transmitted from flea-to-flea, and artificially infected larvae clear the organism within 24 hours. Therefore, maintenance of plague in environment is dependent upon cyclic transmission between fleas and mammals.[2]
http://www.cdc.gov/nczved/divisions/dfbmd/diseases/yersinia/
Summary Data
Lathem et al. (2005) and Parent et al. (2005) respectively inoculated C57BL/6 mice intranasally with the Y. pestis virulent wild-type CO92 strain and with the KIM D27 strain.[4][1] Rogers et al. (2007) administered the Y. pestis CO92 strain to BALB/c mice via intraperitoneal route.[5]
Recommended Model
It is recommended that experiment 1 should be used as the best dose-response model. Compared to experiment 2, a more virulent strain in experiment 1 can be more meaningful for emergency preparedness and public health intervention. Also, the exposure route was intranasal which is a better representation of an actual release scenario over the Intraperitoneal.
References
- (2005). Progression of primary pneumonic plague: A mouse model of infection, pathology, and bacterial transcriptional activity. Proceedings of the National Academy of Sciences of the United States of America. 102, 17786-17791.
- Citekey 1278 not found
- (1982). Plague: review of ecology.. Ecology of disease. 1, 111–115.
- (2005). Cell-Mediated Protection against Pulmonary Yersinia pestis Infection. Infection and Immunity. 73, 11.
- (2007). Transcriptional responses in spleens from mice exposed to Yersinia pestis CO92. Microbial Pathogenesis. 43, 2.
| ID | # of Doses | Agent Strain | Dose Units | Host type | Μodel | Optimized parameters | Response type | Reference |
|---|---|---|---|---|---|---|---|---|
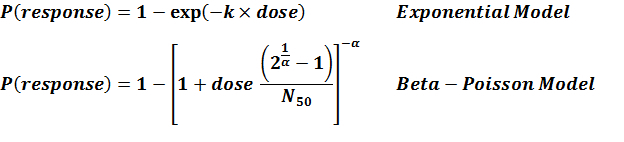
| 1 | 4 | CO92 | CFU | mice | exponential |
k = 1.63E-03 LD50/ID50 = 4.26E+02 |
death | "Progression of primary pneumonic plague: A mouse model of infection, pathology, and bacterial transcriptional activity." Proceedings of the National Academy of Sciences of the United States of America. 102 (2005): 17786-17791. |
| 2 | 4 | KIM D27 | CFU | mice | exponential |
k = 1.07E-04 LD50/ID50 = 6.47E+03 |
death | "Cell-Mediated Protection against Pulmonary Yersinia pestis Infection." Infection and Immunity. 73 (2005): 11. |
| 3 | 5 | CO92 | CFU | mice | exponential |
k = 3.45E-02 LD50/ID50 = 2.01E+01 |
death | "Transcriptional responses in spleens from mice exposed to Yersinia pestis CO92." Microbial Pathogenesis. 43 (2007): 2. |
k = 1.63E-03
LD50/ID50 = 4.26E+02
|
|
||||||||||||||||||||||
|
||||||||||||||||||||||||||||||||||||||
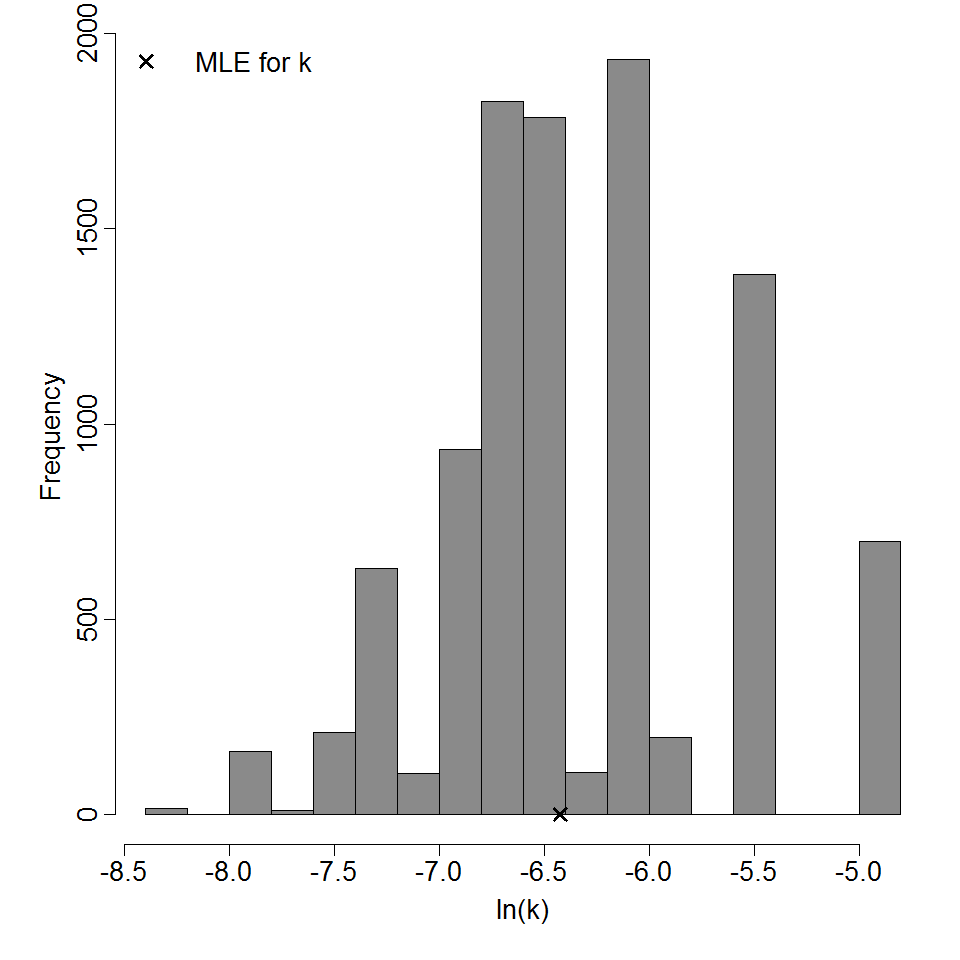
Parameter histogram for exponential model (uncertainty of the parameter)
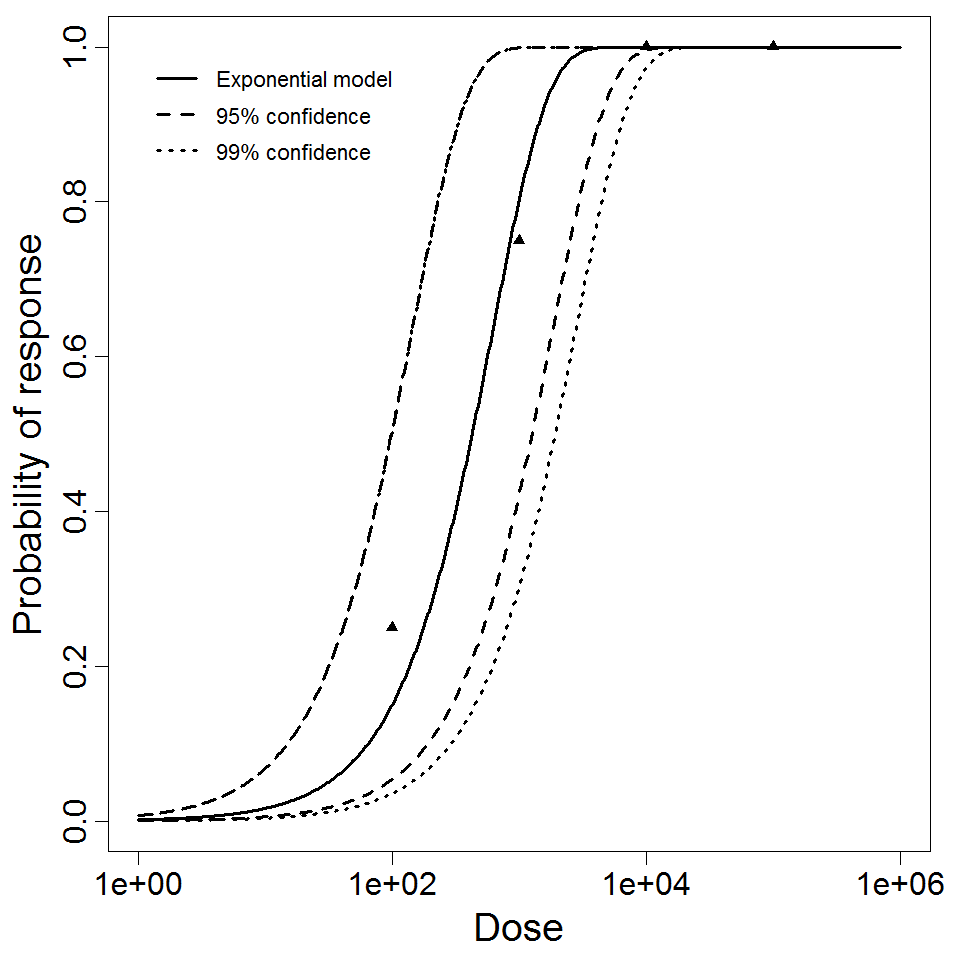
Exponential model plot, with confidence bounds around optimized model
References
k = 1.07E-04
LD50/ID50 = 6.47E+03
|
|
||||||||||||||||||||||
|
||||||||||||||||||||||||||||||||||||||
Parameter histogram for exponential model (uncertainty of the parameter)
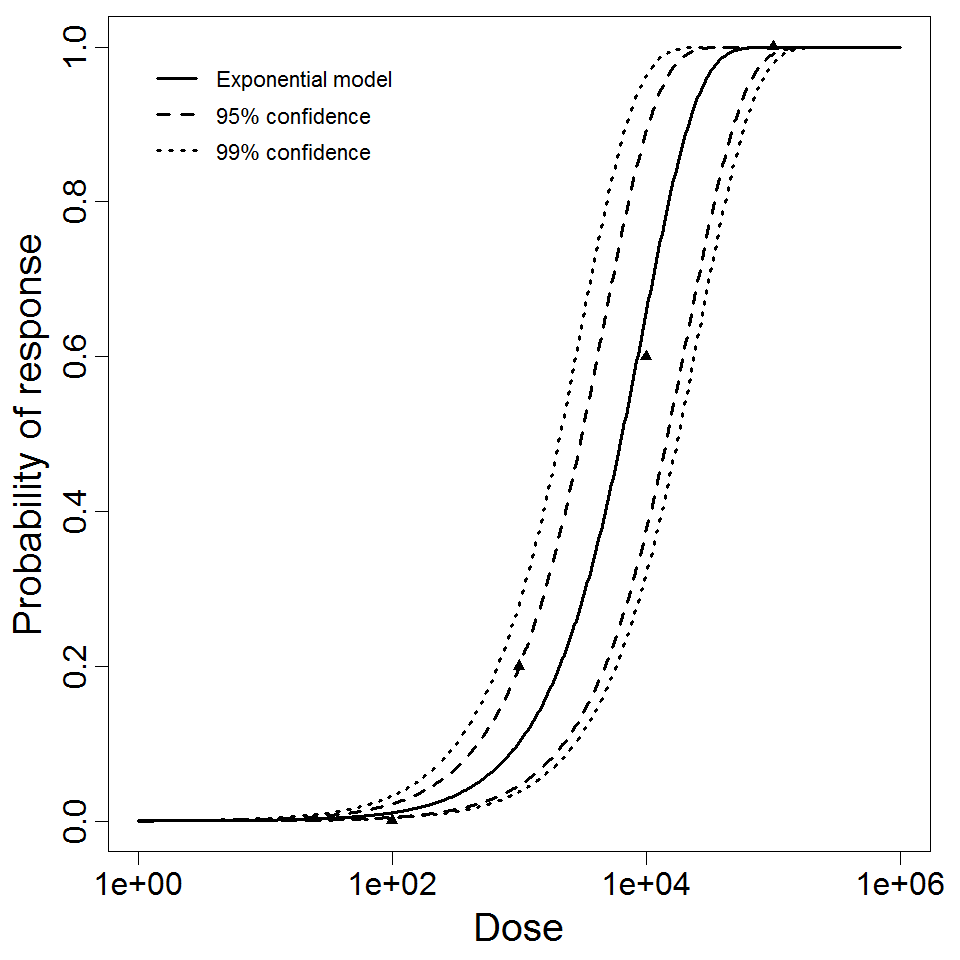
Exponential model plot, with confidence bounds around optimized model
References
k = 3.45E-02
LD50/ID50 = 2.01E+01
|
|
||||||||||||||||||||||
|
||||||||||||||||||||||||||||||||||||||
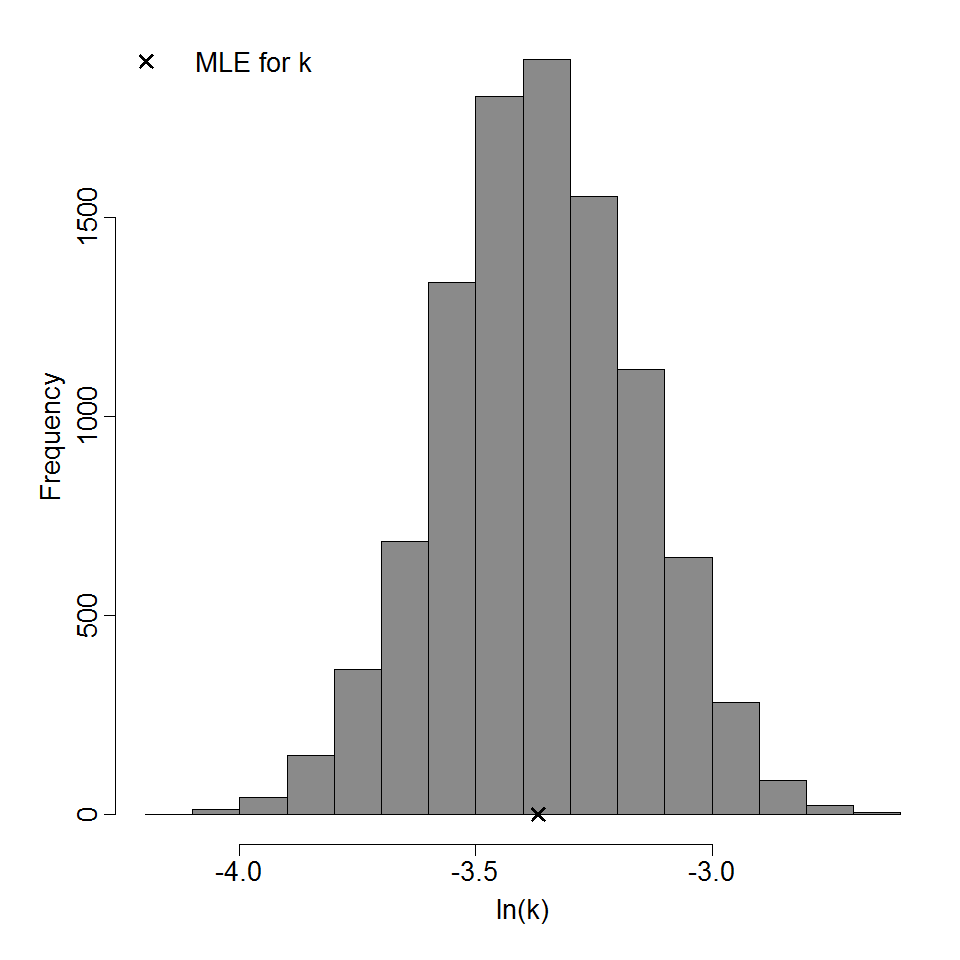
Parameter histogram for exponential model (uncertainty of the parameter)
Exponential model plot, with confidence bounds around optimized model