mice/ H5N1,DKGX/35 strain model data [4]
| Dose |
Dead |
Survived |
Total |
| 10 |
1 |
4 |
5 |
| 100 |
3 |
2 |
5 |
| 1000 |
5 |
0 |
5 |
| 1E+04 |
5 |
0 |
5 |
| 1E+05 |
5 |
0 |
5 |
| 1E+06 |
5 |
0 |
5 |
|
Goodness of fit and model selection
| Model |
Deviance |
Δ |
Degrees
of freedom |
χ20.95,1
p-value |
χ20.95,m-k
p-value |
| Exponential |
0.498 |
0.0917 |
5 |
3.84
0.762 |
11.1
0.992 |
| Beta Poisson |
0.406 |
4 |
9.49
0.982 |
| Exponential is preferred to beta-Poisson; cannot reject good fit for exponential. |
|
Optimized k parameter for the exponential model, from 10000 bootstrap iterations
| Parameter |
MLE estimate |
Percentiles |
| 0.5% |
2.5% |
5% |
95% |
97.5% |
99.5% |
| k |
1.09E-02 |
3.14E-03 |
3.29E-03 |
4.56E-03 |
2.78E-02 |
3.48E-02 |
5.42E-02 |
| ID50/LD50/ETC* |
6.38E+01 |
1.28E+01 |
1.99E+01 |
2.49E+01 |
1.52E+02 |
2.11E+02 |
2.21E+02 |
| *Not a parameter of the exponential model; however, it facilitates comparison with other models. |
|
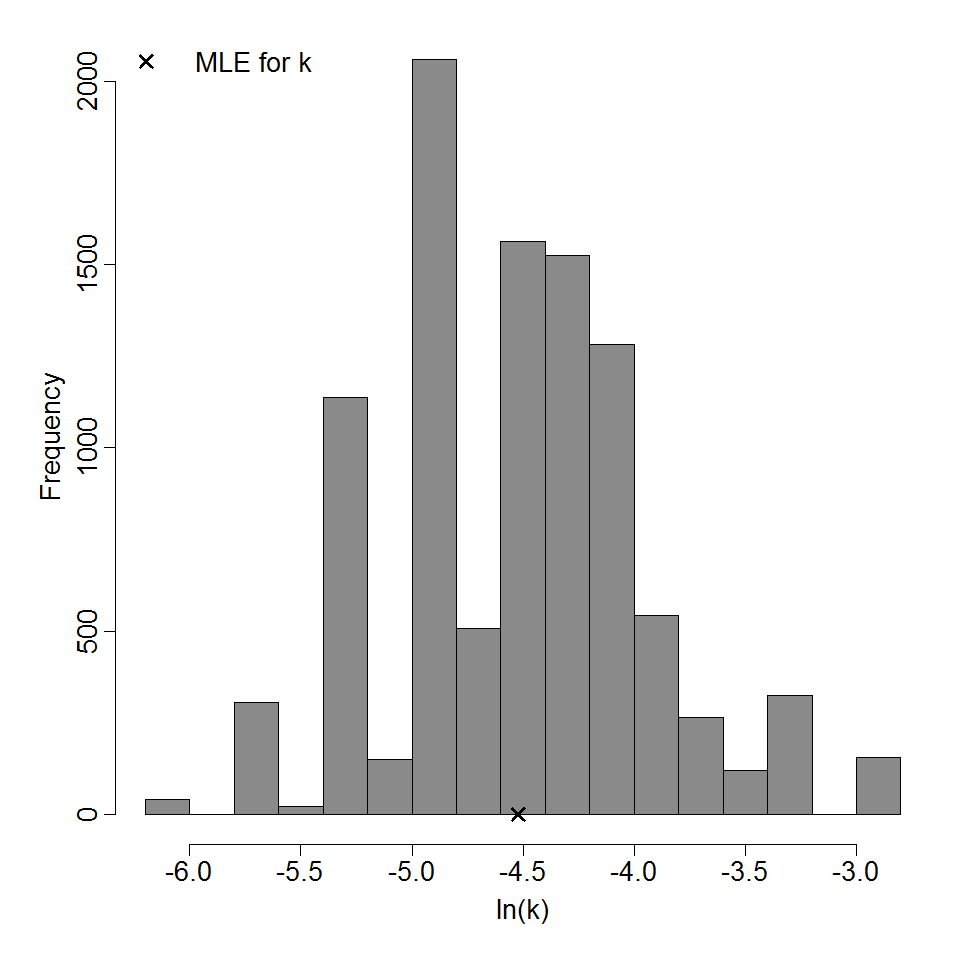
Parameter histogram for exponential model (uncertainty of the parameter)

Exponential model plot, with confidence bounds around optimized model