Escherichia coli (EIEC 4608) in the human model data[1]
| Dose |
Mild to severe diarrhea |
No mild to severe diarrhea |
Total |
| 1E+04 |
0 |
5 |
5 |
| 1E+06 |
0 |
5 |
5 |
| 1E+08 |
5 |
3 |
8 |
|
Goodness of fit and model selection
| Model |
Deviance |
Δ |
Degrees
of freedom |
χ20.95,1
p-value |
χ20.95,m-k
p-value |
| Exponential |
0.0986 |
-0.00188 |
2 |
3.84
1 |
5.99
0.952 |
| Beta Poisson |
0.1 |
1 |
3.84
0.751 |
| Exponential is preferred to beta-Poisson; cannot reject good fit for exponential. |
|
Optimized k parameter for the exponential model, from 10000 bootstrap iterations
| Parameter |
MLE estimate |
Percentiles |
| 0.5% |
2.5% |
5% |
95% |
97.5% |
99.5% |
| k |
9.7E-09 |
2.85E-09 |
2.86E-09 |
4.66E-09 |
2.04E-08 |
2.04E-08 |
5.07E-08 |
| ID50/LD50/ETC* |
7.14E+07 |
1.37E+07 |
3.40E+07 |
3.40E+07 |
1.49E+08 |
2.43E+08 |
2.44E+08 |
| *Not a parameter of the exponential model; however, it facilitates comparison with other models. |
|
Parameter histogram for exponential model (uncertainty of the parameter)
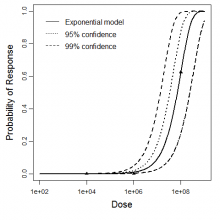
Exponential model plot, with confidence bounds around optimized model
References