| Experiment ID | 79 |
|---|---|
| Pathogen | |
| Contains Preferred Model | 0 |
| Reference |
| Host type | |
|---|---|
| # of Doses | 3.00 |
| Μodel | |
| a | 1.11E-01 |
| N50 | 3.45E+06 |
| LD50/ID50 | 3.45E+06" |
| Dose Units | |
| Response | |
| Agent Strain | Quailes |
| Exposure Route | |
| Experiment Dataset |
Description:
|
|
||||||||||||||||||||||
|
||||||||||||||||||||||||||||||
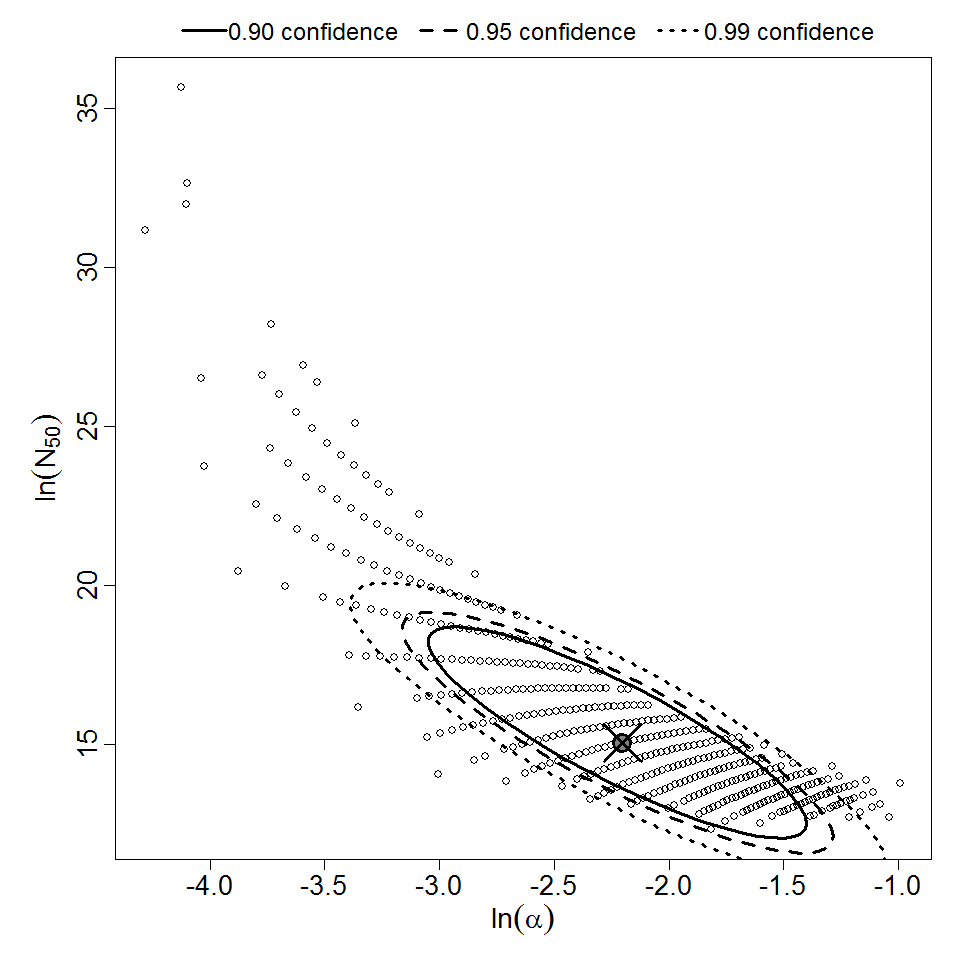
Parameter scatter plot for beta Poisson model ellipses signify the 0.9, 0.95 and 0.99 confidence of the parameters.
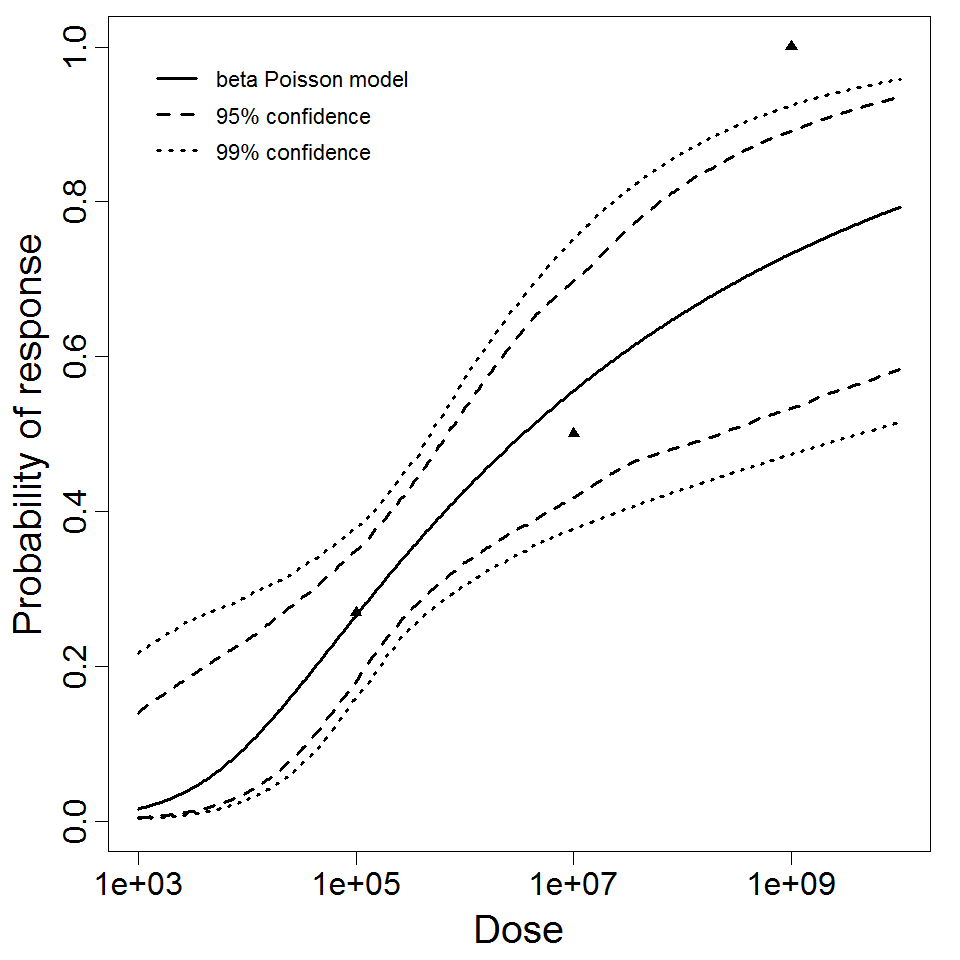
beta Poisson model plot, with confidence bounds around optimized model