Guinea pig/ATCC 6605 Strain model data [1]
| Dose |
Dead |
Survived |
Total |
| 30 |
0 |
6 |
6 |
| 300 |
1 |
5 |
6 |
| 3000 |
0 |
10 |
10 |
| 3E+04 |
3 |
7 |
10 |
| 3E+05 |
8 |
2 |
10 |
| 3E+06 |
10 |
0 |
10 |
|
Goodness of fit and model selection
| Model |
Deviance |
Δ |
Degrees
of freedom |
χ20.95,1
p-value |
χ20.95,m-k
p-value |
| Exponential |
8.56 |
1.81 |
5 |
3.84
0.178 |
11.1
0.128 |
| Beta Poisson |
6.75 |
4 |
9.49
0.15 |
| Exponential is preferred to beta-Poisson; cannot reject good fit for exponential. |
|
Optimized parameters for the exponential model, from 10000 bootstrap iterations
| Parameter |
MLE estimate |
Percentiles |
| 0.5% |
2.5% |
5% |
95% |
97.5% |
99.5% |
| k |
7.11E-06 |
2.60E-06 |
3.52E-06 |
3.87E-06 |
1.61E-05 |
1.97E-05 |
2.85E-05 |
| ID50/LD50/ETC* |
9.75E+04 |
2.43E+04 |
3.52E+04 |
4.30E+04 |
1.79E+05 |
1.97E+05 |
2.66E+05 |
| *Not a parameter of the exponential model; however, it facilitates comparison with other models. |
|
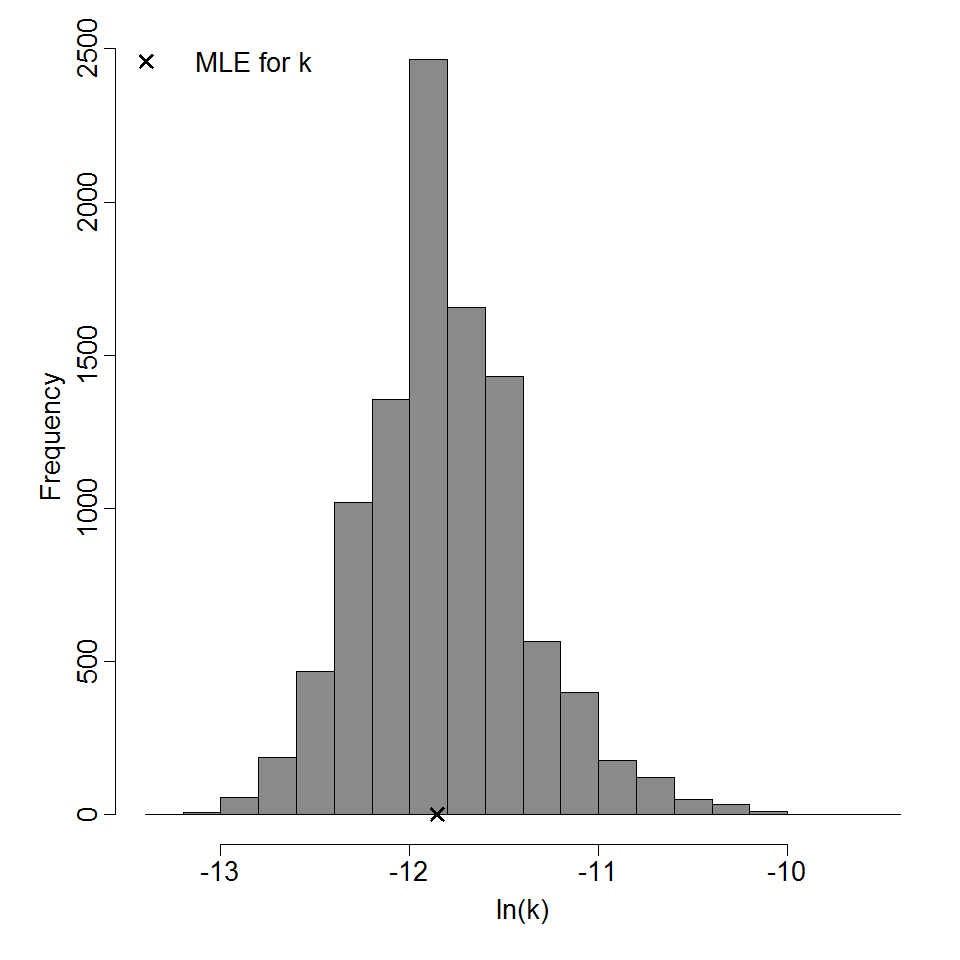
Parameter histogram for exponential model (uncertainty of the parameter)
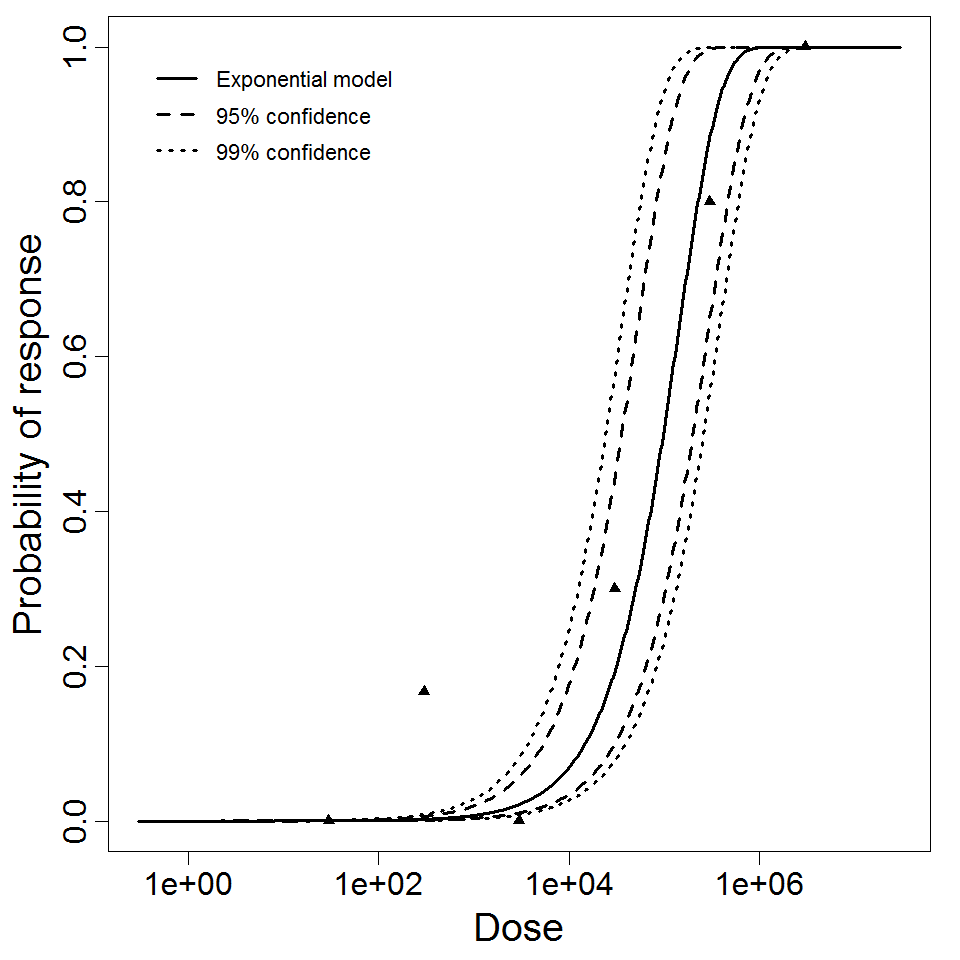
Exponential model plot, with confidence bounds around optimized model
References