Rhesus Macaques/Vollum Strain model data [1]
| Dose |
Dead |
Survived |
Total |
| 70300 |
1 |
7 |
8 |
| 77000 |
4 |
4 |
8 |
| 109000 |
5 |
3 |
8 |
| 138000 |
6 |
2 |
8 |
| 156000 |
5 |
3 |
8 |
| 161000 |
3 |
5 |
8 |
| 240000 |
8 |
0 |
8 |
| 3E+05 |
7 |
1 |
8 |
| 398000 |
8 |
0 |
8 |
|
Goodness of fit and model selection
| Model |
Deviance |
Δ |
Degrees
of freedom |
χ20.95,1
p-value |
χ20.95,m-k
p-value |
| Exponential |
11.3 |
-0.000503 |
8 |
3.84
1 |
15.5
0.188 |
| Beta Poisson |
11.3 |
7 |
14.1
0.128 |
| Exponential is preferred to beta-Poisson; cannot reject good fit for exponential. |
|
Optimized parameters for the exponential model, from 10000 bootstrap iterations
| Parameter |
MLE estimate |
Percentiles |
| 0.5% |
2.5% |
5% |
95% |
97.5% |
99.5% |
| k |
7.16E-06 |
4.99E-06 |
5.47E-06 |
5.71E-06 |
9.09E-06 |
9.51E-06 |
1.05E-05 |
| ID50/LD50/ETC* |
9.69E+04 |
6.63E+04 |
7.29E+04 |
7.63E+04 |
1.21E+05 |
1.27E+05 |
1.39E+05 |
| *Not a parameter of the exponential model; however, it facilitates comparison with other models. |
|

Parameter histogram for exponential model (uncertainty of the parameter)
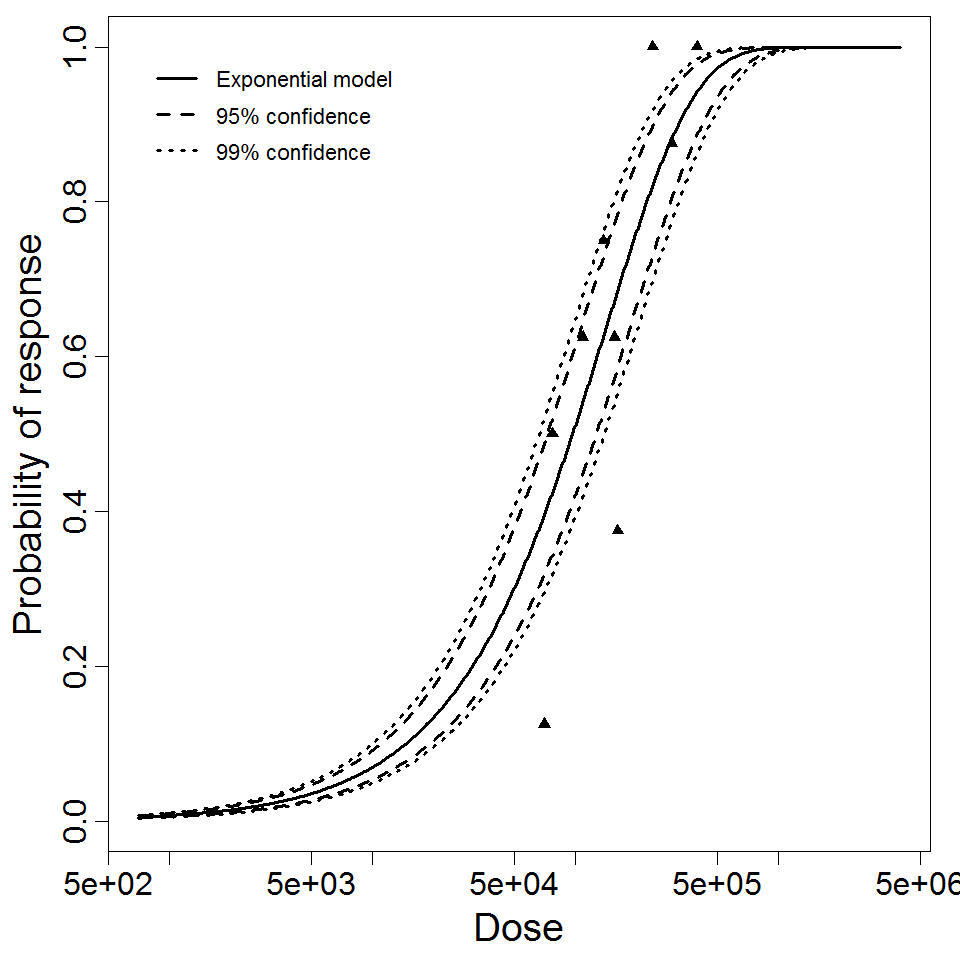
Exponential model plot, with confidence bounds around optimized model
References