General overview
Bacillus anthracis is a rod shaped gram negative bacterium which is the causative agent of the disease anthrax. Anthrax can be subdivided into three main categories generically named for the route of exposure or affected terminal organs, and are cutaneous, inhalational and gastrointestinal anthrax. Cutaneous anthrax is the most common form of naturally occurring anthrax. Although this type of the disease may be debilitating or scarring to the host, it is not typically fatal especially where modern healthcare is available. Inhalational anthrax is the most lethal form of the disease and the preferred form of anthrax in bioterror scenarios. Inhalation of the spores introduces them to the lower regions of the lungs (alveoli, or air sacs) where oxygen and carbon dioxide are exchanged with the blood. At this location the pathogenesis of B. anthracis occurs where eventually after intracellular transport can result in septicemia and death. Gastrointestinal anthrax is a very rare form of the disease. This form of anthrax is typically observed with immune-compromised individuals or with those exposed to an overwhelming load of pathogens. This form of the disease is potentially lethal due to the development of a systemic infection from the internal infection.
There are three main strains of B. anthracis. The Ames strain garnered wide public attention during the 2001 anthrax postal attacks. The Vollum strain is a weaponized form that is comparatively more infectious than the Ames strain. There is also an attenuated vaccine strain, known as the Sterne strain. The main datasets gathered for B. anthracis are for the Vollum strain.
https://www.cdc.gov/anthrax/index.html
In Druett et al (1953) both rhesus macaques and guinea pigs were exposed to an aerosol of spores, while conscious. The macaques and guinea pigs were monitored for mortality, thus allowing for a dose response model estimating the probability of death from aerosol exposure to spores.
In Altboum et al (2002) female Hartley guinea pigs were first rendered unconscious then dosed intranasally with B. anthracis spores. Mortality was monitored for and the lethality rate was recorded, it is this mortality rate that is being modeled with respect to dose. Therefore this dose response model is for a lethal response to inhaled spores. The isolate preparation was not described thoroughly, however the overall dose was estimated in the paper in units of spores inhaled.
Recommended Model
It is recommended that experiment 87 be used as the best dose response model for use. Although guinea pigs are not as representative of humans as the rhesus macaques in 86, the optimized model had the best fit based on the minimized deviance and likelihood ratio test performed. Additionally, the use of the Vollum strain is better able to simulate an attack scenario than the attenuated strain used in experiment 85.
\begin{align*} P(response) = 1- e^{-k \times dose} \end{align*}
\begin{align*} P(response) = 1 - [1 + dose\frac{(2^{\frac{1}{\alpha}} -1)}{N_{50}}]^{-\alpha} \end{align*}
Advanced Dose Response Model
An advanced dose response model was developed for Bacillus anthracis , in which the physiology of the host as well as the pathogenesis of inhaled spores, was modeled and integrated into the does response models. First the fate and transport of inhaled spores was modeled in a stochastic system (Markov chain), and then coupled with a deterministic model of the pathogenesis of inhaled spores.
This first (stochastic) model used independently allows for the estimation of a correction factor for correcting exposed dose to delivered dose . The left figure shows the linear correction factor for human respiratory systems, which remains linear when the same model is adapted to guinea pig or rhesus macaque respiratory systems. The pathogenesis model simulates the survival, germination, and eventual growth of B. anthracis rods. Therefore the coupled models allow for an estimation of the pathogen burden, since the coupled model accounts for fate and transport as well as the pathogenesis. Again as can be seen in the right figure, this is a linear correction as well.
These correction factors can be incorporated into the dose response models by multiplying the dose by the chosen correction factor; ηdd for delivered dose and ηpb for pathogen burden (equations 1 and 2 for the exponential model and 3 and 4 for the beta Poisson). The ηdd allows for a drop in the number of spores, since there are some being entrapped along the path through the respiratory system, with a value for ηdd of 0.000834 for humans. Conversely the pathogen burden accounts for; fate and transport survival and growth of the bacilli in the body therefore, this correction factor allows for an increase between exposed dose and pathogen burden, thus ηpb is 1.528 for humans.
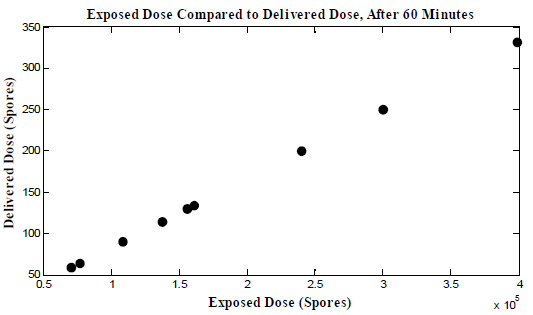
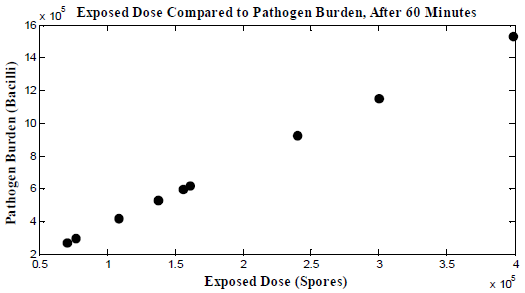
Linear correction factor to estimate delivered dose from exposed dose Linear correction factor to estimate pathogen burden from exposed dose
\begin{align*} P(response) = 1 - e^{-k*dose*\eta_{dd}} \end{align*} (1)
\begin{align*} P(response) = 1 - e^{-k*dose*\eta_{pb}} \end{align*} (2)
\begin{align*} P(response) = 1 - [1+ \frac{dose*\eta_{dd}*2^{\frac{1}{\alpha}}-1}{N_{50}}]^{-\alpha} \end{align*} (3)
\begin{align*} P(response) = 1 - [1+ \frac{dose*\eta_{pb}*2^{\frac{1}{\alpha}}-1}{N_{50}}]^{-\alpha} \end{align*} (4)
| ID | Exposure Route | # of Doses | Agent Strain | Dose Units | Host type | Μodel | LD50/ID50 | Optimized parameters | Response type | Reference |
|---|---|---|---|---|---|---|---|---|---|---|
| 84 | inhalation | 6.00 | Vollum | spores | guinea pig | beta-Poisson | 2.85E+04 | a = 5.49E-01 N50 = 2.85E+04 | death |
Altboum, Z. ., Gozes, Y. ., Barnea, A. ., Pass, A. ., White, M. ., & Kobiler, D. . (2002). Postexposure prophylaxis against anthrax: evaluation of various treatment regimens in intranasally infected guinea pigs. Infection and Immunity, 70, 6231–6241. |
| 85 | inhalation | 6.00 | ATCC 6605 | spores | guinea pig | exponential | 9.75E+04 | k = 7.11E-06 | death |
Druett, H. A., Henderson, D. W., Packman, L. ., & Peacock, S. . (1953). Studies on respiratory infection. The Journal of Hygiene, 51, 3. |
| 86 | inhalation | 9.00 | Vollum | spores | monkey | exponential | 9.69E+04 | k = 7.16E-06 | death |
Druett, H. A., Henderson, D. W., Packman, L. ., & Peacock, S. . (1953). Studies on respiratory infection. The Journal of Hygiene, 51, 3. |
| 87 | inhalation | 4.00 | Vollum | spores | guinea pig | exponential | 4.2E+04 | k = 1.65E-05 | death |
June, R. ., Ferguson, W. ., & Worfel, M. . (1953). Experiments in feeding adult volunteers with Escherichia coli 55, B5, a coliform organism associated with infant diarrhea. American Journal of Hygiene, 57(2). https://doi.org/10.1093/oxfordjournals.aje.a119570 |
|
|
||||||||||||||||||||||
|
||||||||||||||||||||||||||||||
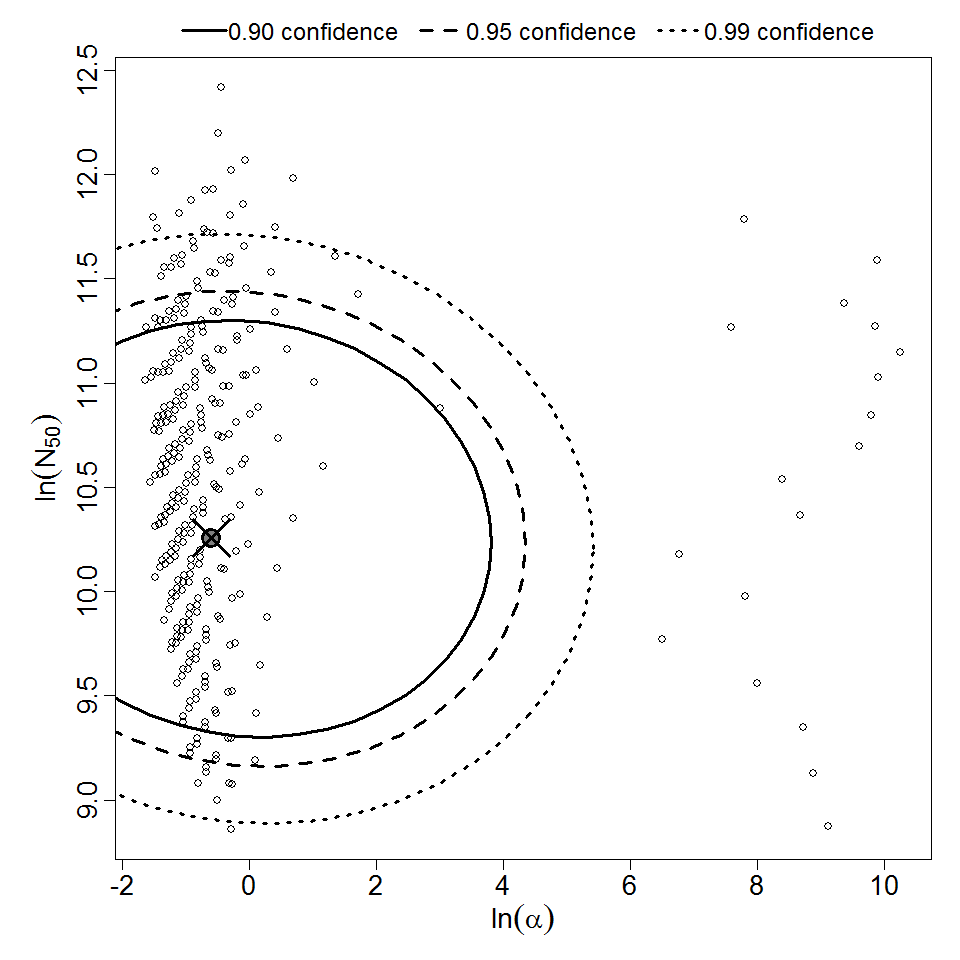
Parameter scatter plot for beta Poisson model ellipses signify the 0.9, 0.95 and 0.99 confidence of the parameters.
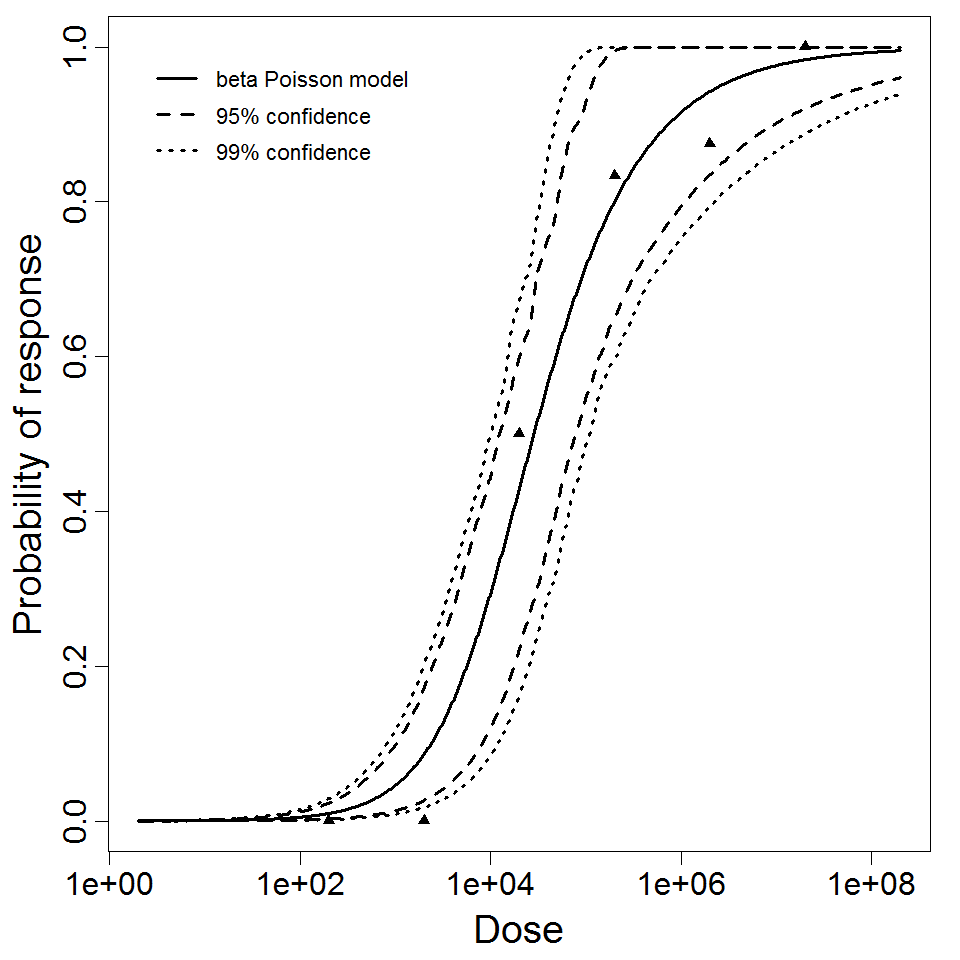
beta Poisson model plot, with confidence bounds around optimized model
|
|
||||||||||||||||||||||
|
||||||||||||||||||||||||||||||||||||||

Parameter histogram for exponential model (uncertainty of the parameter)
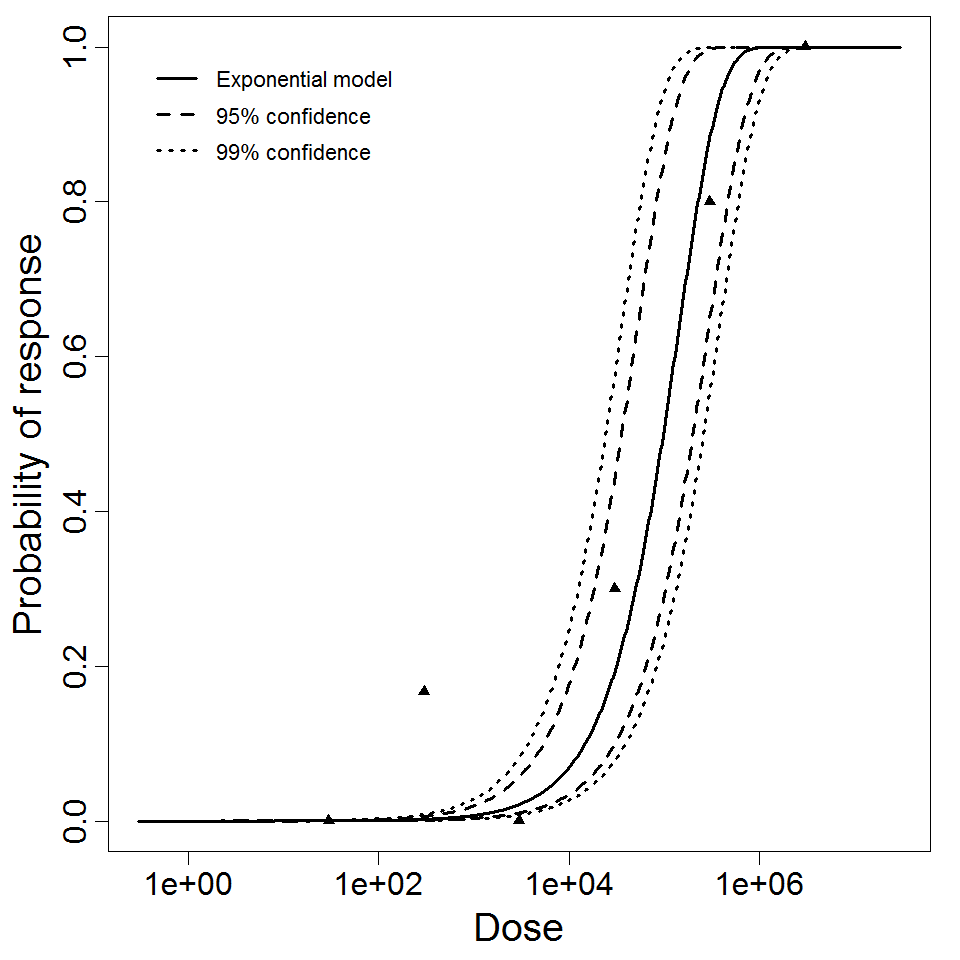
Exponential model plot, with confidence bounds around optimized model
|
|
||||||||||||||||||||||
|
||||||||||||||||||||||||||||||||||||||

Parameter histogram for exponential model (uncertainty of the parameter)
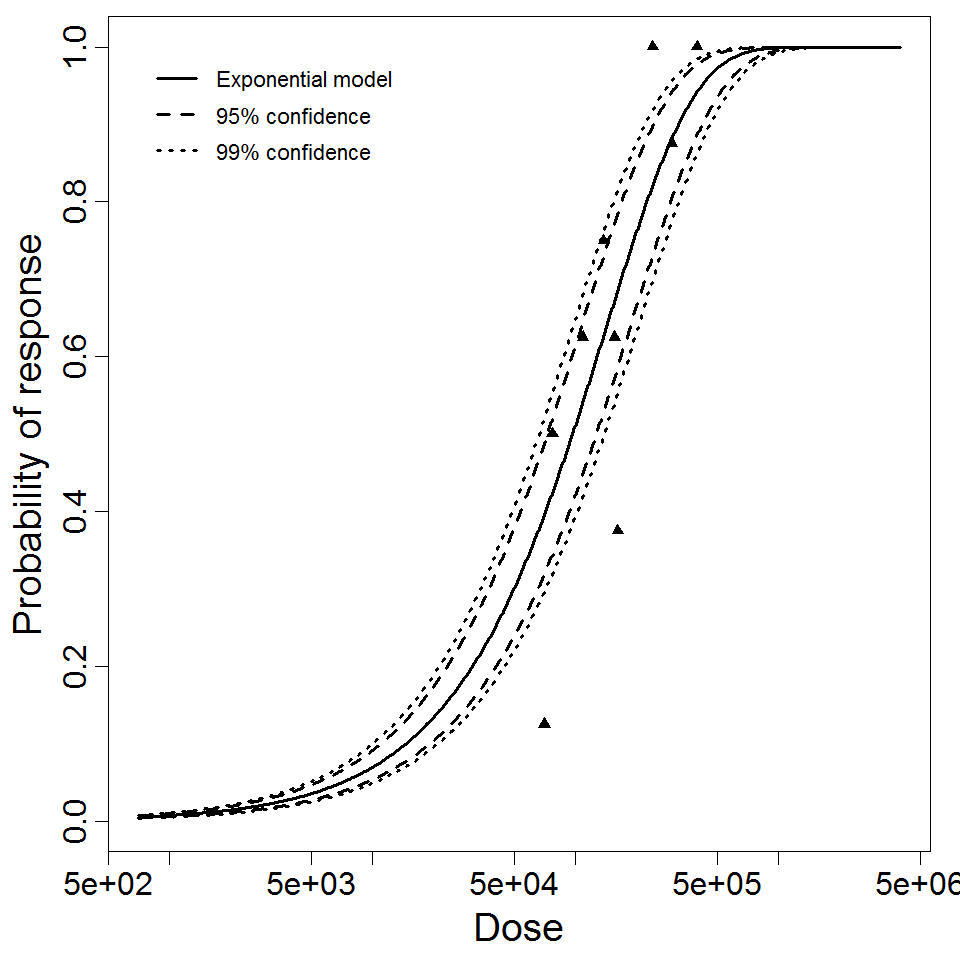
Exponential model plot, with confidence bounds around optimized model
|
|
||||||||||||||||||||||
|
||||||||||||||||||||||||||||||||||||||

Parameter histogram for exponential model (uncertainty of the parameter)
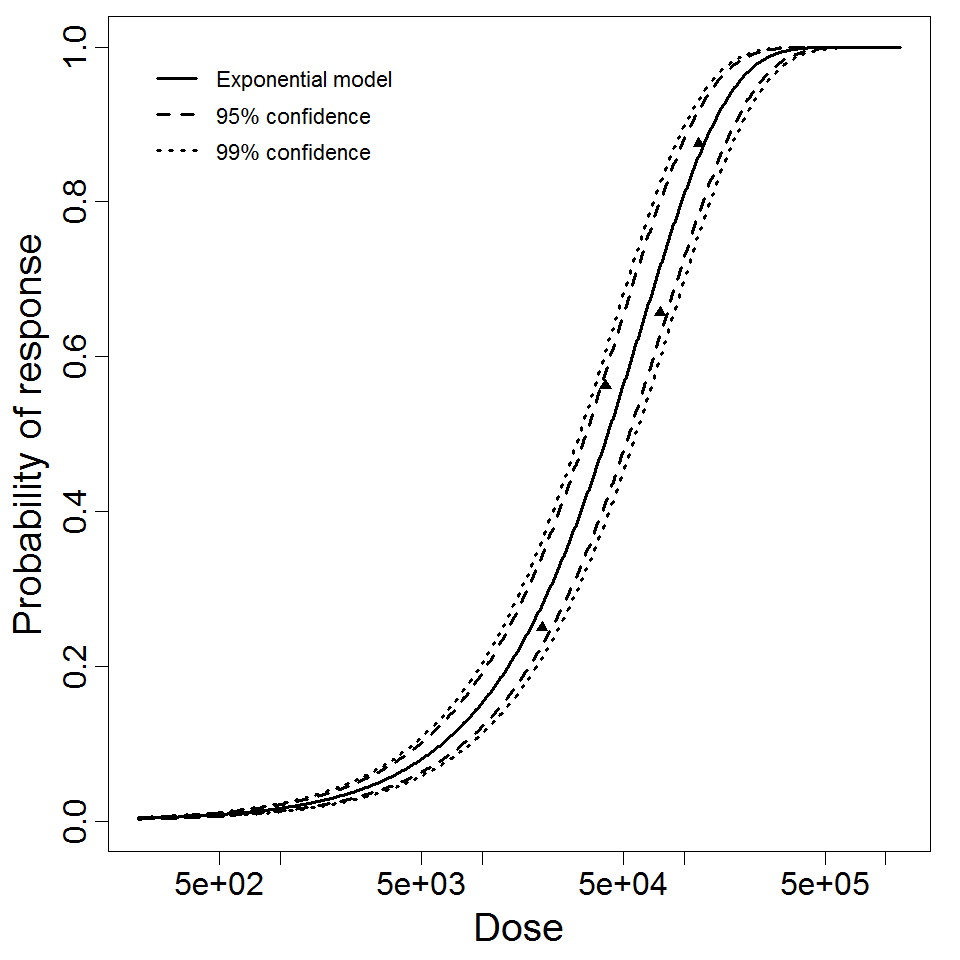
Exponential model plot, with confidence bounds around optimized model
