| Experiment ID |
21,23
|
|---|---|
| Pathogen | |
| Agent Strain |
W294, 316c
|
| Contains Preferred Model |
No
|
| Reference |
Miller, W. R., Pannell, L. ., Cravitz, L. ., Tanner, W. A., & Rosebury, T. . (1948). Studies on Certain Biological Characteristics of Malleomyces mallei and Malleomyces pseudomallei. Journal of Bacteriology, 55, 1. |
| Exposure Route |
intraperitoneal
|
| Response |
death
|
| Host type |
guinea pig and diabetic rat
|
||||||||||||||||||||
|---|---|---|---|---|---|---|---|---|---|---|---|---|---|---|---|---|---|---|---|---|---|
| # of Doses |
11.00
|
||||||||||||||||||||
| Dose Units |
CFU
|
||||||||||||||||||||
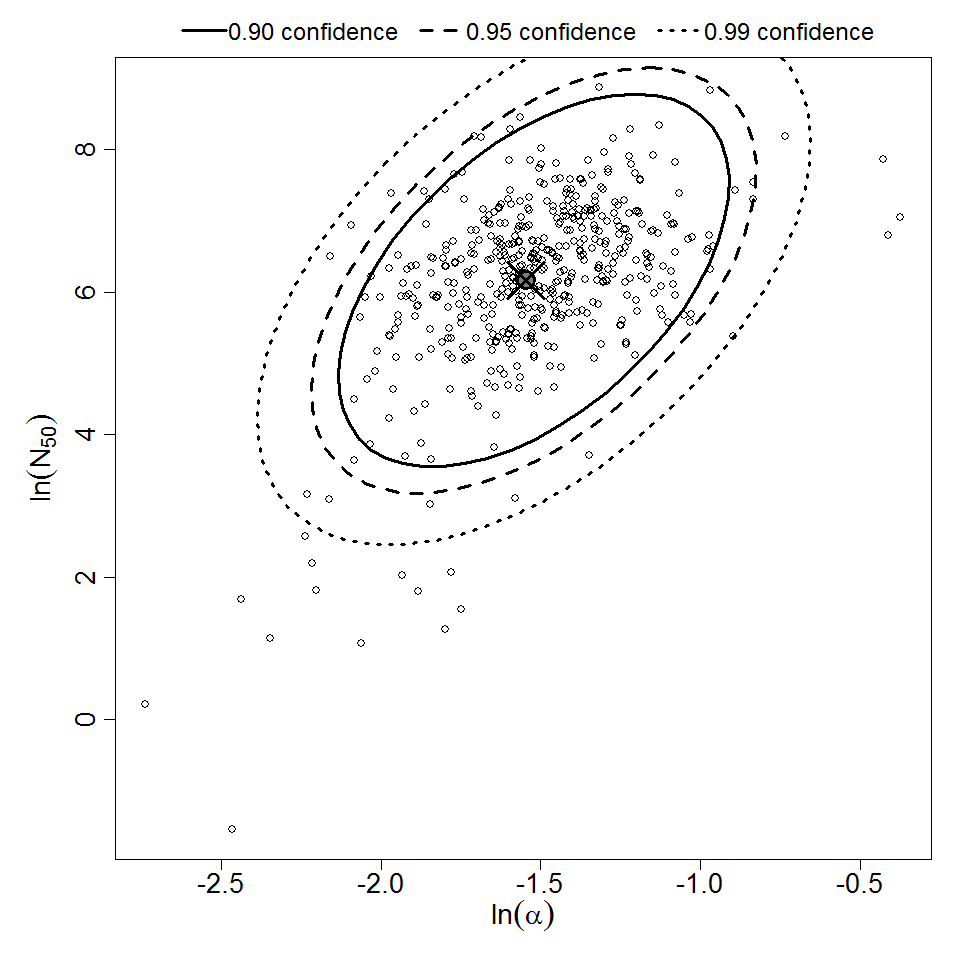
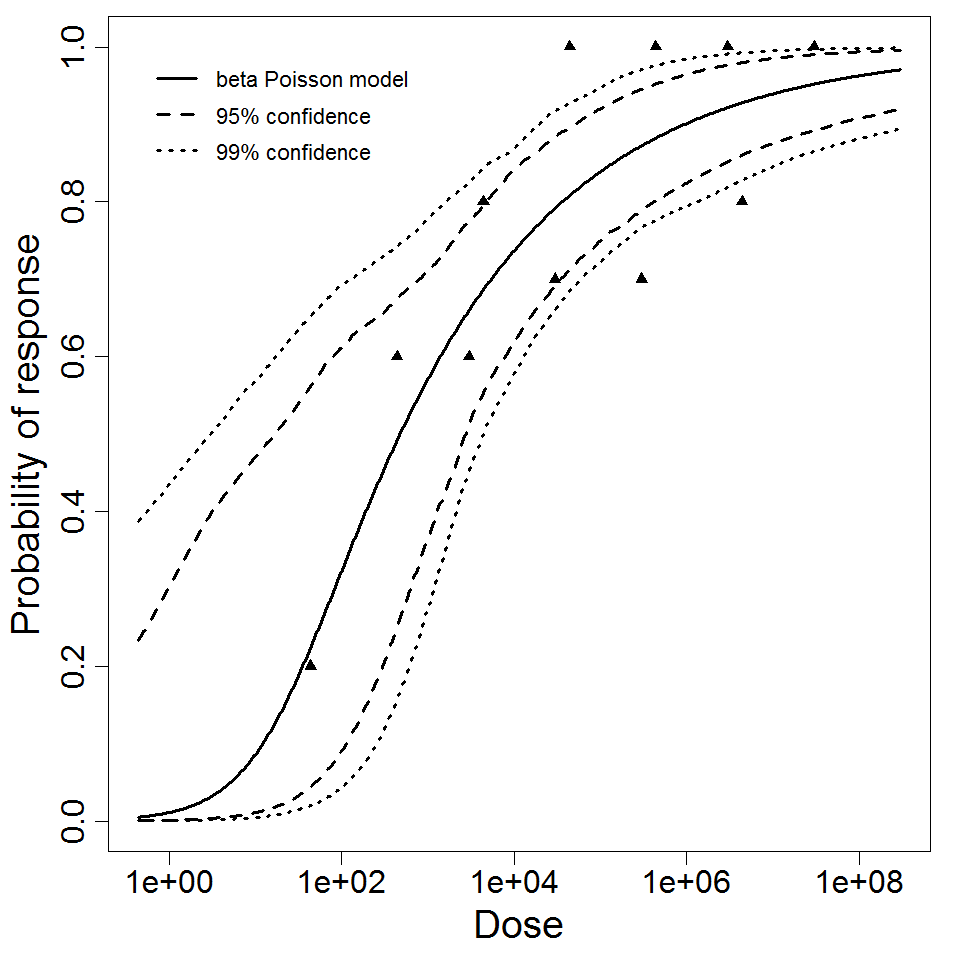
| Μodel |
beta-Poisson
|
||||||||||||||||||||
| a |
2.13E-01
|
||||||||||||||||||||
| N50 |
4.77E+02
|
||||||||||||||||||||
| LD50/ID50 |
4.77E+02
|
||||||||||||||||||||
| Experiment Dataset |
|
Description
| ||||||||||||||||||||||
| ||||||||||||||||||||||||||||||