General Overview
Coxiella burnetii (C. burnetii), an obligate intracellular gram-negative bacterium, is the causative agent of Q fever. C. burnetii multiplies only within the phagolysosomal vacuoles, particularly the macrophages of the host. During natural infections, the organism grows to high numbers in placental tissues of animals such as goats, sheep, and cows. The U.S. Centers for Disease Control and Prevention (CDC) has classified C. burnetii as a category B biological terrorist agent because it consistently causes disability, can be manufactured on a large scale, remains stable under production, storage, and transportation conditions, can be efficiently disseminated and remains viable for years after dissemination.
Q fever, a zoonotic disease found worldwide, may manifest as acute or chronic disease. The acute form is generally not fatal and manifests as self-controlled febrile illness. Chronic Q fever is usually characterized by endocarditis. Many mamalian models, including humans, have been studied for Q fever infection through various exposure routes.
Humans are infected primarily through inhalation of aerosolized C. burnetii. Aerosols, or airborne particles, easily cause infection even without contact with infected animals, whereas person-to-person infection is rare. Ingestion of contaminated dairy products or bites from infected ticks may also lead to infection but these modes of transmission are very rare. However, there have been some recorded cases of human Q fever caused by the consumption of unpasteurized goat's milk products .
Summary of Data
Williams and Cantrell (1982) intraperitoneally inoculated groups of C57BL/10ScN male mice by C. burnetii phase I Ohio strain to develop a vaccine against Q fever.
Scott and Williams (1987) examined the susceptibility of inbred mice to infection by C. burnetii Nine mile phase I strain. As many as 47 strains of inbred mice were evaluated. Groups of resistant C57BL/6J mice were inoculated with mean doses ranging from 10−1.3 to 107 organisms. The mortalities at various doses were recorded.
The apparent difference of LD50 between the experiment 28 (4.93x10⁸) and experiment 26 (1.22 x10¹⁰) routes while are similar may be associated with differences in susceptible hosts and pathogen strains.
Recommended Model
It is recommended that experiment 28 should be used as the best dose-response model. A more virulent strain in experiment 28 can be more meaningful for emergency preparedness. Also, single host strain was used in experiment 28 instead of multiple strains as in experiment 26.
| ID | Exposure Route | # of Doses | Agent Strain | Dose Units | Host type | Μodel | LD50/ID50 | Optimized parameters | Response type | Reference |
|---|---|---|---|---|---|---|---|---|---|---|
| 26 | intraperitoneal | 13.00 | Nine mile phase I | PFU | C57BL/6 mice | exponential | 1.22E+10 | k = 5.7E-11 | death |
Scott, G. ., Williams, J. C., & Stephenson, E. H. (1987). Animal models in Q fever: pathological responses of inbred mice to phase I Coxiella Burnetii. Journal of General Microbiology, 133, 691-700. |
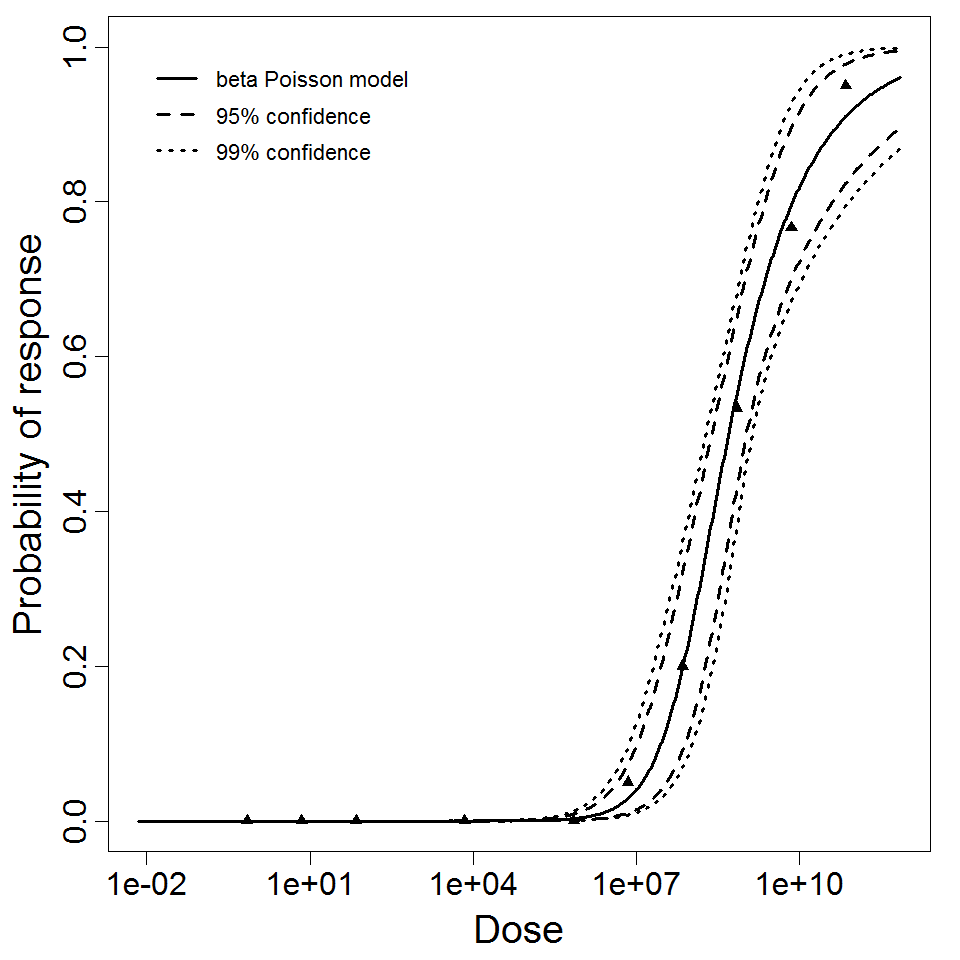
| 28 | intraperitoneal | 10.00 | phase I Ohio | PFU | C57BL/1OScN mice | beta-Poisson | 4.93E+08 | a = 3.57E-01 N50 = 4.93E+08 | death |
Williams, J. C., & Cantrell, J. L. (1982). Biological and immunological properties of Coxiella burnetii vaccines in C57BL/10ScN endotoxin-nonresponder mice. Infection and Immunity, 35, 3. |
|
||||||||||||||||||||||
|
||||||||||||||||||||||||||||||||||||||

Parameter histogram for exponential model (uncertainty of the parameter)

Exponential model plot, with confidence bounds around optimized model
|
|
||||||||||||||||||||||
|
||||||||||||||||||||||||||||||

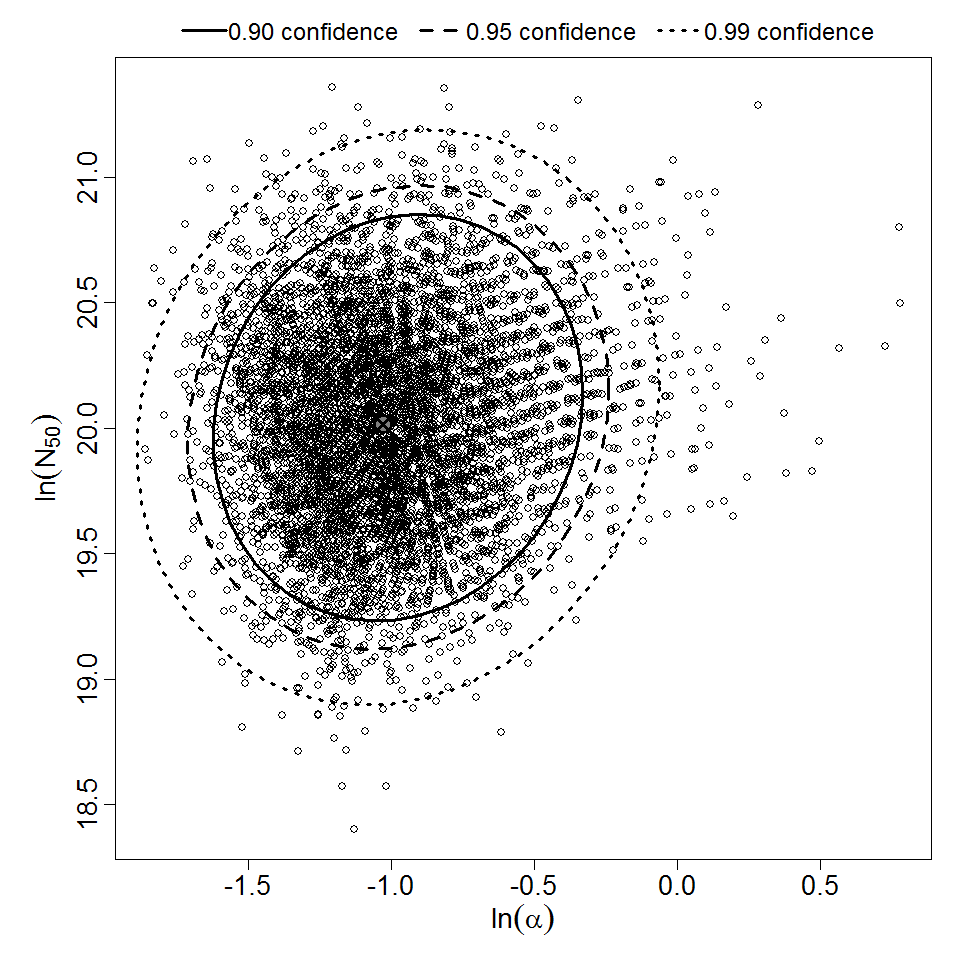
Parameter scatter plot for beta Poisson model ellipses signify the 0.9, 0.95 and 0.99 confidence of the parameters.

beta Poisson model plot, with confidence bounds around optimized model