General Overview
According to Stalkup and Chilukuri, enterovirus, a small (30 nm), nonenveloped, single-stranded RNA viruses, belongs to the family Picornaviridae. While most of the enterovirus infections are relatively mild and result in complete recovery of the patient, they can also cause severe and fatal diseases such as meningitis, encephalitis, myocarditis, neonatal sepsis, and polio like paralytic diseases. Infection occurs mainly via fecal-oral transmission and less commonly by respiratory droplets. While no known non-human reservoirs have been identified, water-borne, foodborne, and blood-borne transmissions have been reported.
Summary Data
Cliver challenged pigs with Porcine enterovirus type 3 and 7 via oral exposure route.
| ID | Exposure Route | # of Doses | Agent Strain | Dose Units | Host type | Μodel | LD50/ID50 | Optimized parameters | Response type | Reference |
|---|---|---|---|---|---|---|---|---|---|---|
| 62 | oral | 3.00 | porcine, PE3-ECPO-6 | PFU | pig | exponential | 2.34E+03 | k = 2.96E-04 | infection |
Cliver, D. O. (1981). Experimental infection by waterborne enteroviruses. Journal of Food Protection, 44, 861–865. Retrieved from http://www.jfoodprotection.org/doi/abs/10.4315/0362-028X-44.11.861?code=fopr-site |
| 63 | oral | 3.00 | porcine, PE7-05i | PFU | pig | exponential | 1.85E+02 | k = 3.74E-03 | infection |
Cliver, D. O. (1981). Experimental infection by waterborne enteroviruses. Journal of Food Protection, 44, 861–865. Retrieved from http://www.jfoodprotection.org/doi/abs/10.4315/0362-028X-44.11.861?code=fopr-site |
|
|
||||||||||||||||||||||
|
||||||||||||||||||||||||||||||||||||||

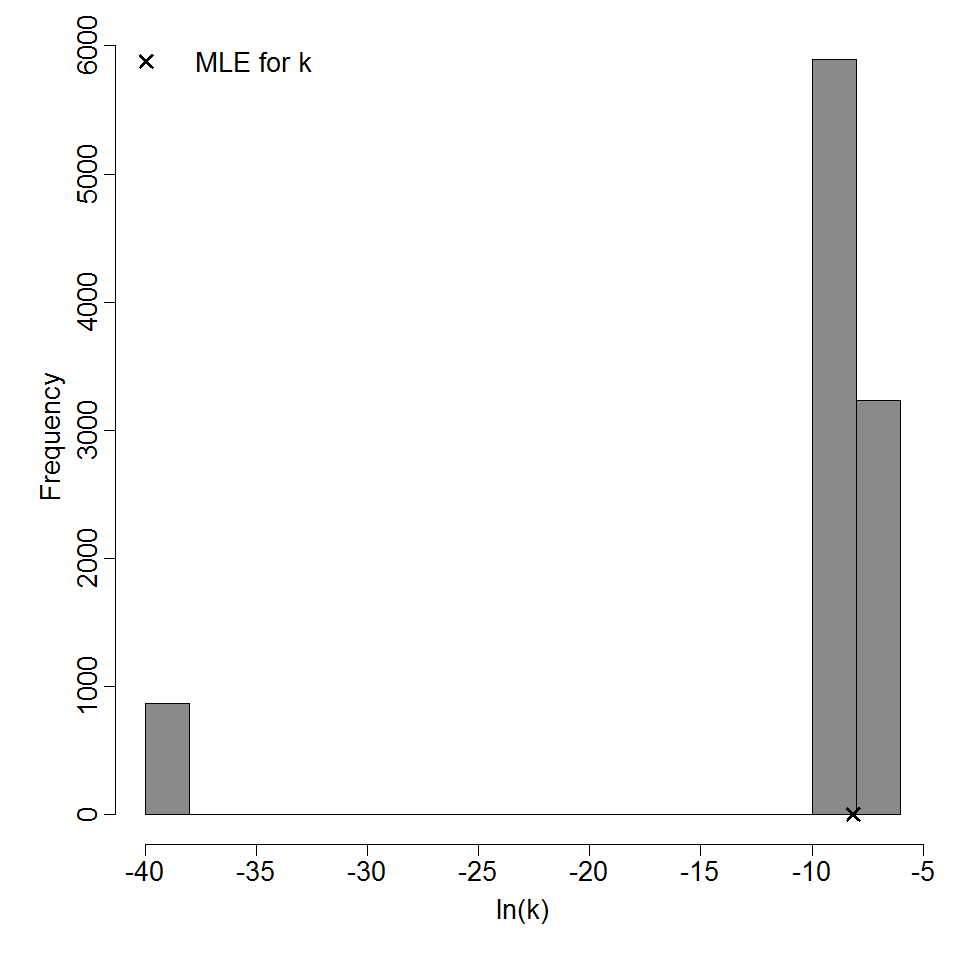
Parameter histogram for exponential model (uncertainty of the parameter)

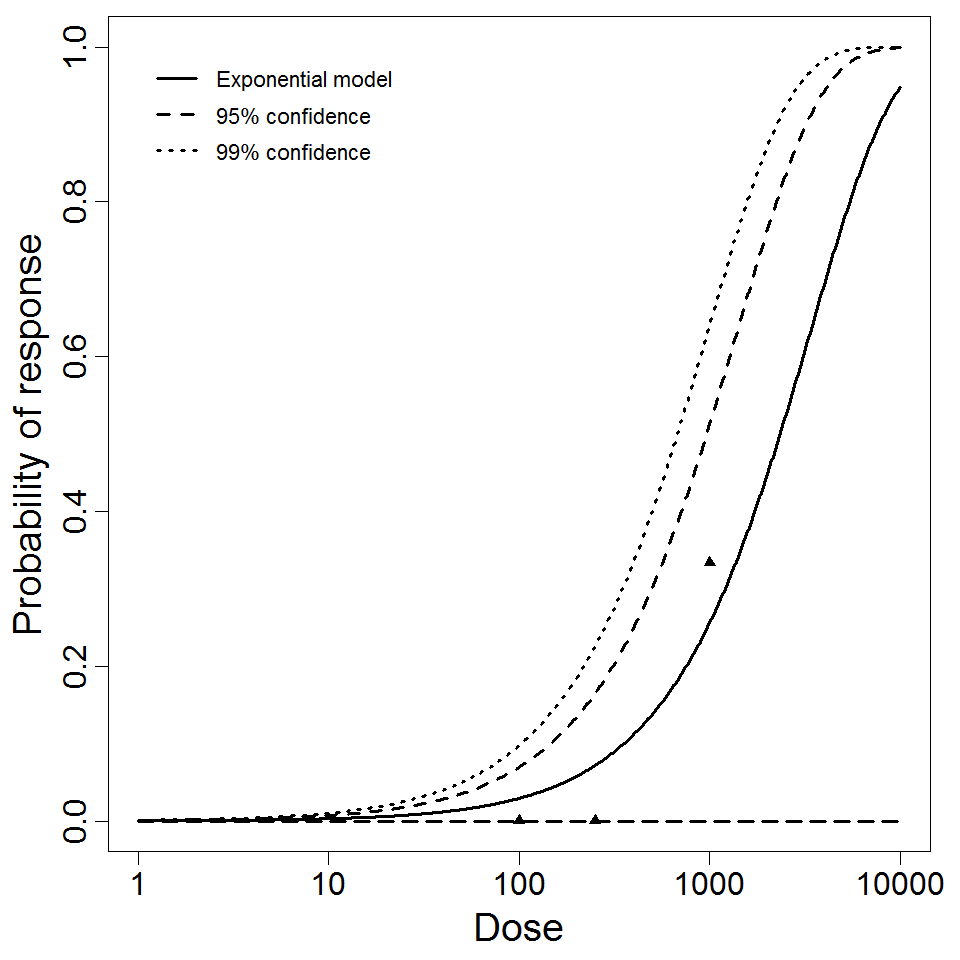
Exponential model plot, with confidence bounds around optimized model
|
|
||||||||||||||||||||||
|
||||||||||||||||||||||||||||||||||||||

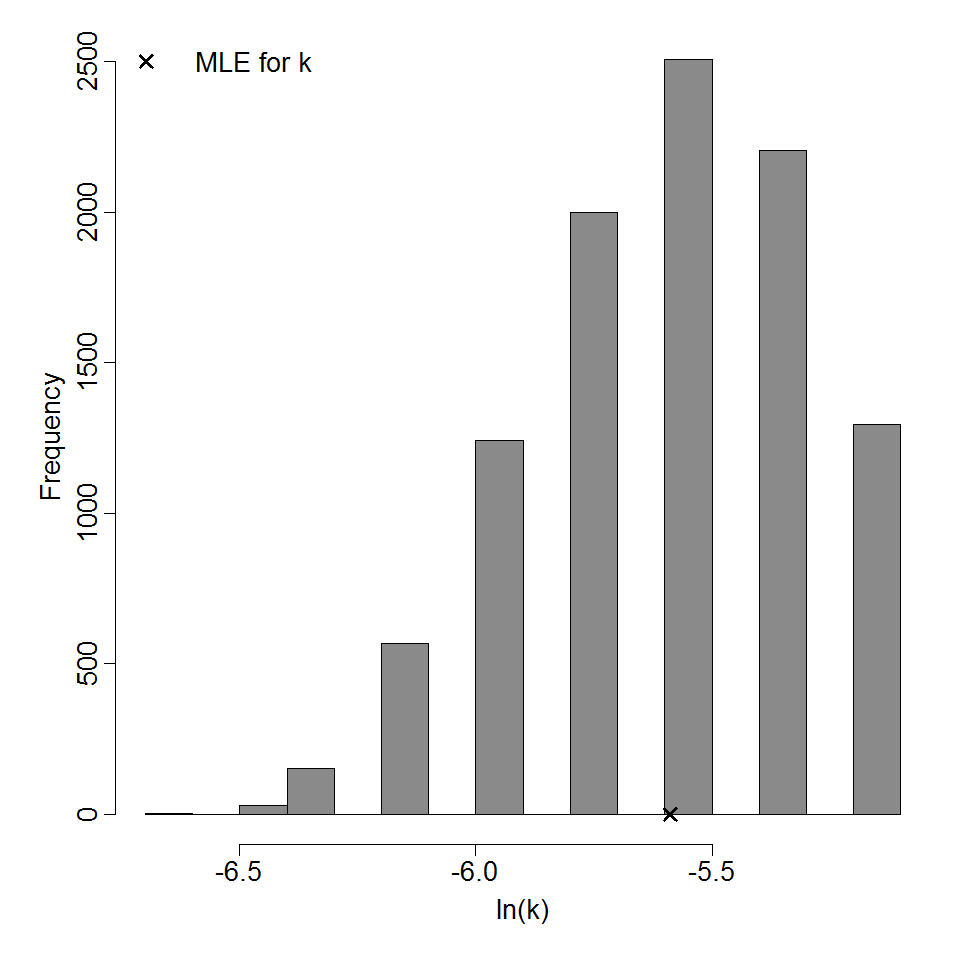
Parameter histogram for exponential model (uncertainty of the parameter)

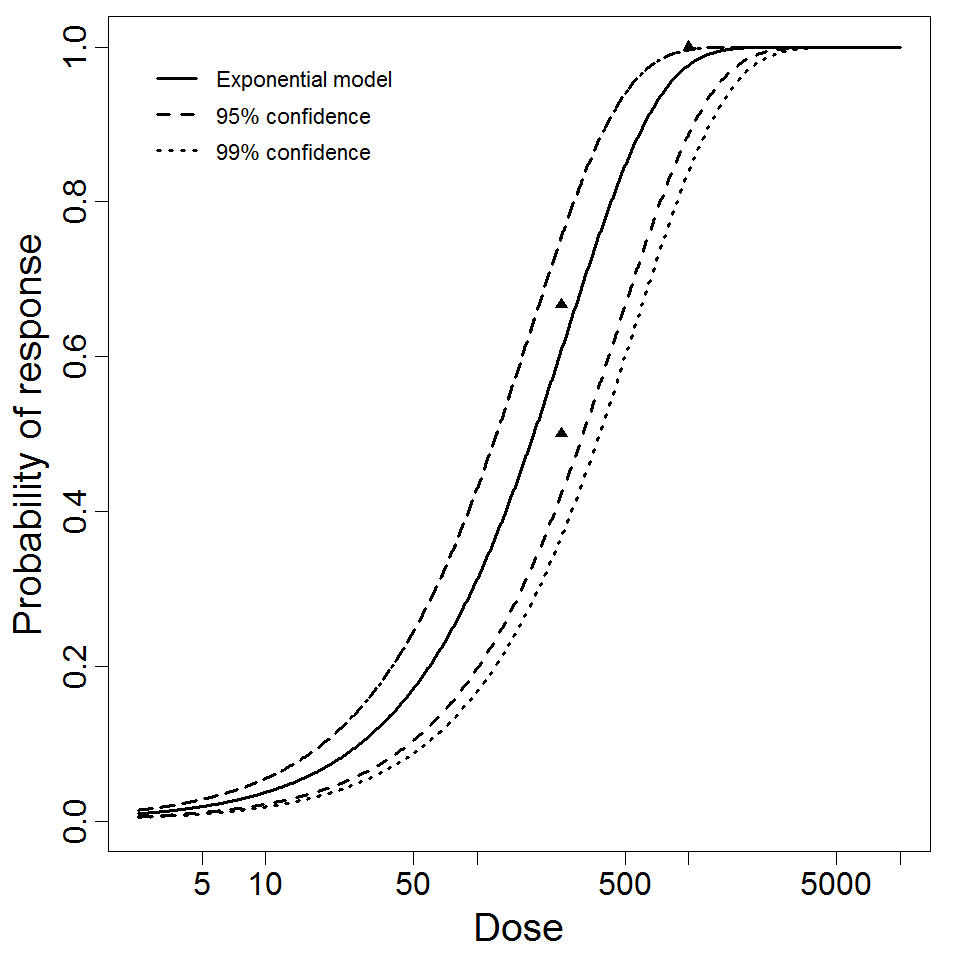
Exponential model plot, with confidence bounds around optimized model