Overview
Giardia is a flagellated protozoan parasite of vertebrates. It attaches noninvasively to the small intestinal wall and absorbs nutrients (Miliotis & Bier 2003). Cysts are intermittently excreted in the stools of infected people; they are infectious immediately. Giardiasis often presents with diarrhea and flatulence, with foul-smelling foamy stools (Miliotis and Bier 2003). It can often last for 6 to 10 weeks or more without treatment; furthermore, the disease may appear to resolve, only to return later (Miliotis & Bier 2003). Partial immunity appears to develop, and infections are often asymptomatic (Miliotis & Bier 2003). Immunity is incomplete and appears to apply more to symptomatic disease than actual infection (Valentiner-Branth et al. 2003).
The taxonomy of the genus Giardia is somewhat unclear. There have been a variety of species names assigned to pathogenic Giardia in humans, including G. intestinalis, G. enterica, and G. lamblia. The currently accepted name is G. duodenalis (Monis et al. 2009). Although it has been commonly considered a zoonosis, recent evidence indicates that G. duodenalis assemblages A and B (with B sometimes referred to as G. enterica) are more specific to humans (Monis et al. 2009). Dose response relationships vary depending on assemblage and host. It is difficult to distinguish Giardia assemblages morphologically; molecular methods are required (Monis et al. 2009).
Summary of Data
Rendtorff (1954) conducted a series of feeding studies in adult male prisoners. The dose response model that best fits these data is an exponential model with an ID50 of 35 cysts. Essentially the same model fit was obtained by Rose et al. (1991). This model has been found to be consistent with results from an epidemiological study in France of diarrhea and drinking water quality (Zmirou-Navier et al. 2006).
Erlandsen et al. (1969) experimentally infected wild beavers and muskrats with human-derived Giardia cysts. Giardia was much less potent in these experiments (compared to Rendtorff (1954)). This illustrates the necessity of considering assemblage and host when applying a Giardia dose response model.
Another dataset describing Giardia dose response in humans during an outbreak at a ski resort in Colorado has been published (Istre et al. 1984). However, dose is described subjectively as glasses of water consumed, and the concentration of cysts in the water was not measured, so it is not possible to tie the response directly to the numbers of cysts consumed.
Recommendations
For most risk applications in humans, the model fit to experiment 46 is preferable. However, the other models may be useful for describing zoonotic Giardia infection.
| ID | Exposure Route | # of Doses | Agent Strain | Dose Units | Host type | Μodel | LD50/ID50 | Optimized parameters | Response type | Reference |
|---|---|---|---|---|---|---|---|---|---|---|
| 46 | oral | 8.00 | From an infected human | Cysts | human | exponential | 3.48E+01 | k = 1.99E-02 | infection |
Rendtorff, R. C. (1954). The experimental transmission of human intestinal protozoan parasites. II. Giardia lamblia cysts given in capsules. American Journal of Hygiene, 59, 2. Retrieved from https://academic.oup.com/aje/article-abstract/59/2/196/89318?redirectedFrom=PDF |
| 47 | oral | 4.00 | From infected humans | Cysts | beaver | beta-Poisson | 1.46E+04 | a = 1.37E-01 N50 = 1.46E+04 | infection |
Erlandsen, S. L., Sherlock, L. A., Januschka, M. ., Schupp, D. G., Schaefer, F. W., Jakubowski, W. ., & Bemrick, W. J. (1988). Cross-species transmission of Giardia spp.: inoculation of beavers and muskrats with cysts of human, beaver, mouse, and muskrat origin. Applied and Environmental Microbiology, 54, 11. Retrieved from http://aem.asm.org/content/54/11/2777.abstract |
|
|
||||||||||||||||||||||
|
||||||||||||||||||||||||||||||||||||||

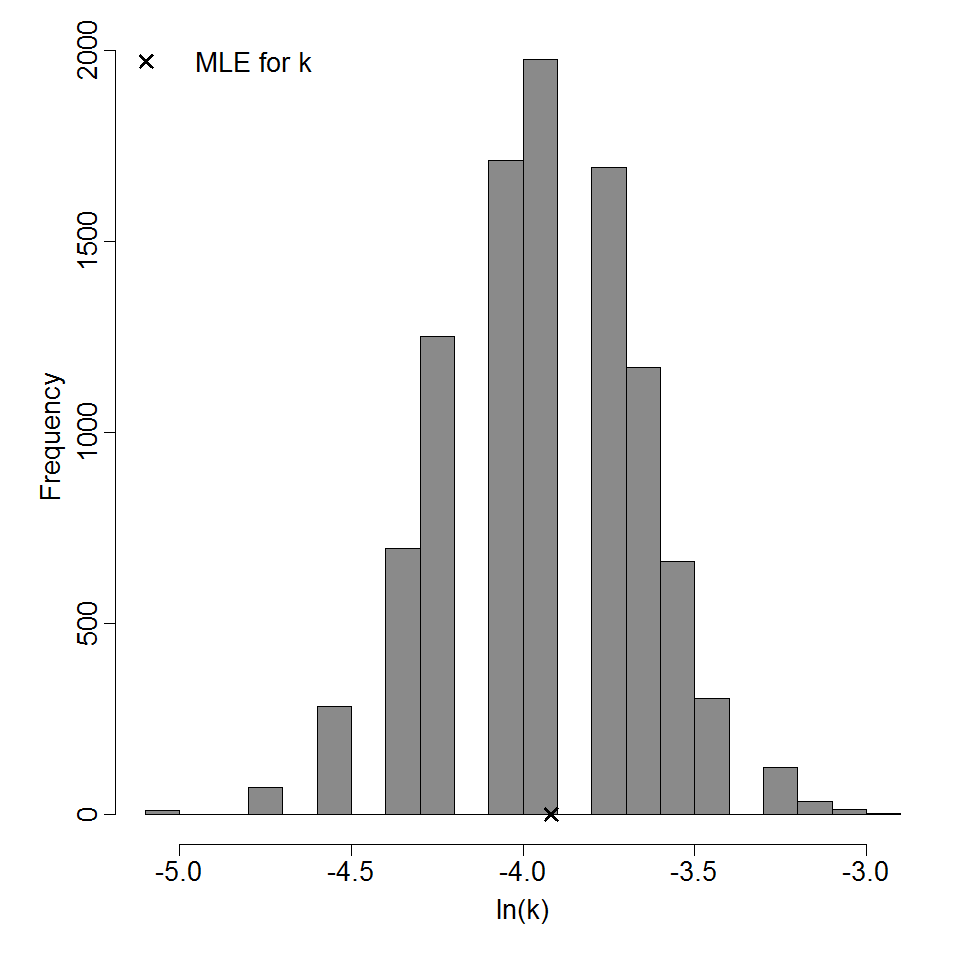
Parameter histogram for exponential model (uncertainty of the parameter)

Exponential model plot, with confidence bounds around optimized model
|
|
||||||||||||||||||||||
|
||||||||||||||||||||||||||||||

Parameter scatter plot for beta Poisson model ellipses signify the 0.9, 0.95 and 0.99 confidence of the parameters.

beta Poisson model plot, with confidence bounds around optimized model