Description
|
||||||||||||||||||||||
|
||||||||||||||||||||||||||||||
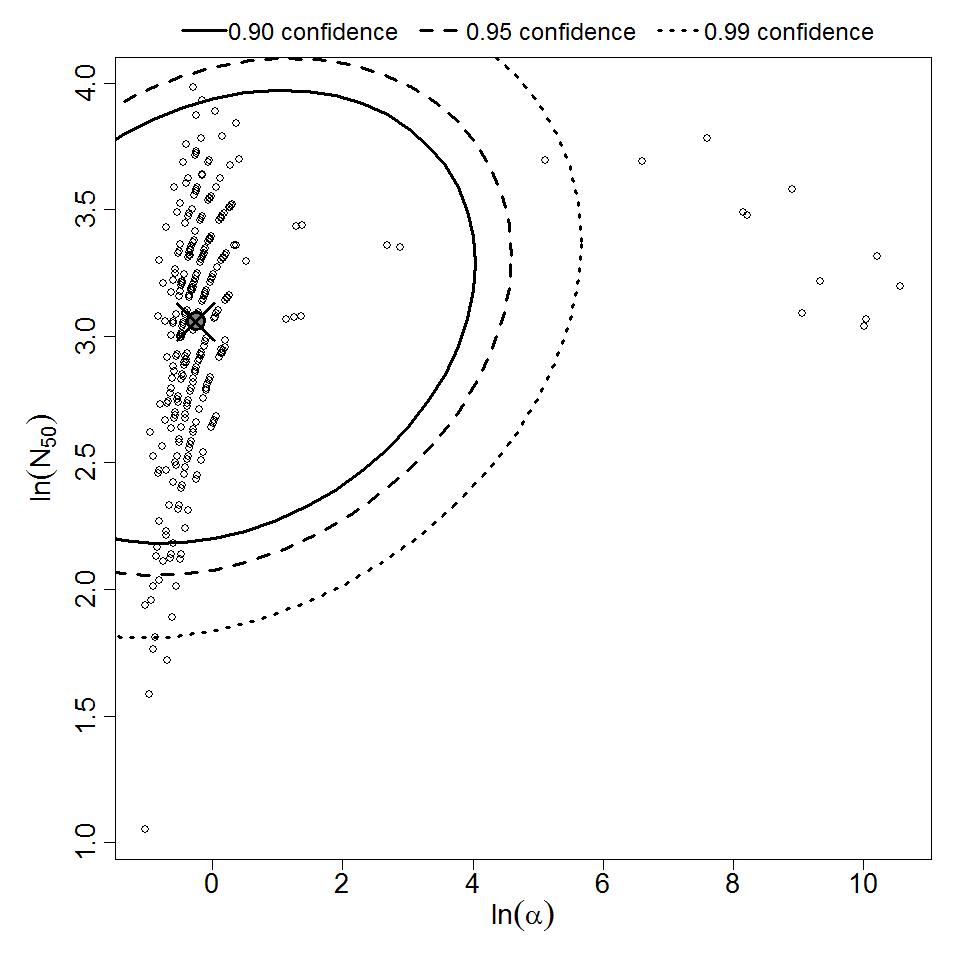
Parameter scatter plot for beta Poisson model ellipses signify the 0.9, 0.95 and 0.99 confidence of the parameters.

beta Poisson model plot, with confidence bounds around optimized model
# of Doses
27.00
Μodel
N50
2.13E+01
LD50/ID50
2.13E+01
Dose Units
Response
Contains Preferred Model
a
7.77E-01
Agent Strain
R1 and Sheila Smith
Experiment ID
300 and 301
Host type
Description
|
|
||||||||||||||||||||||
|
||||||||||||||||||||||||||||||
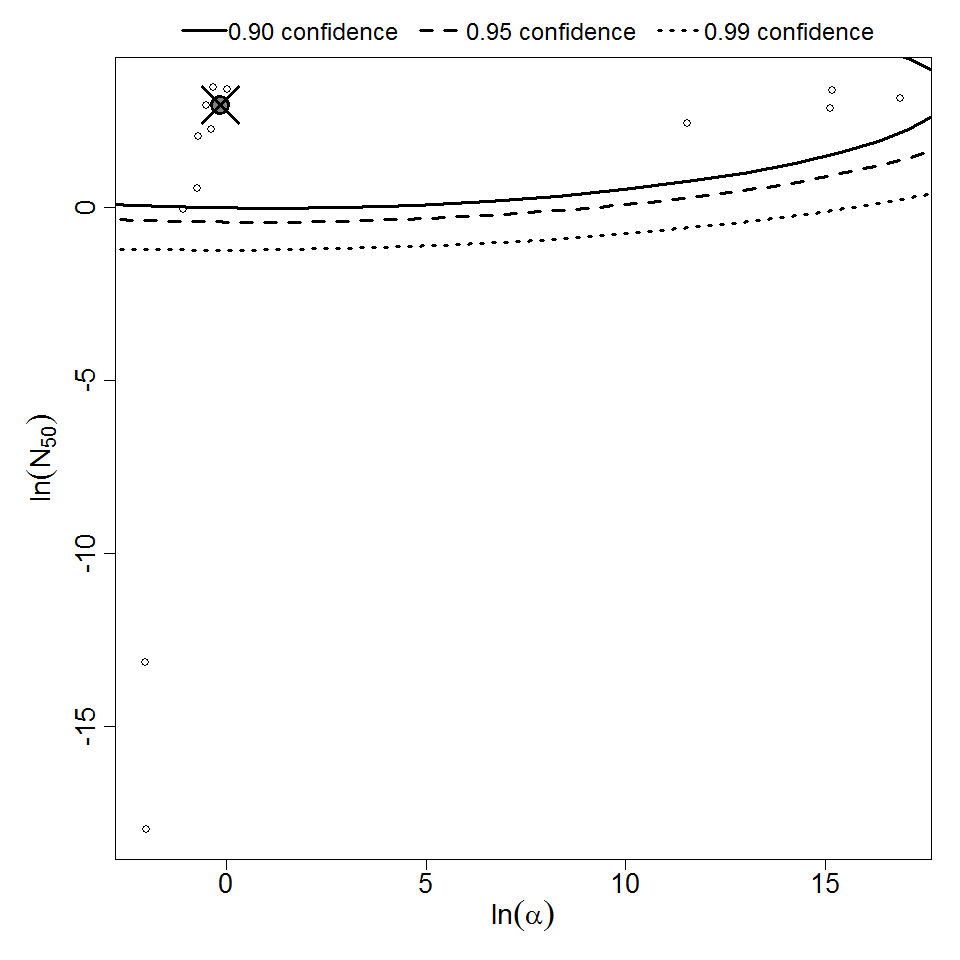
Parameter scatter plot for beta Poisson model ellipses signify the 0.9, 0.95 and 0.99 confidence of the parameters.
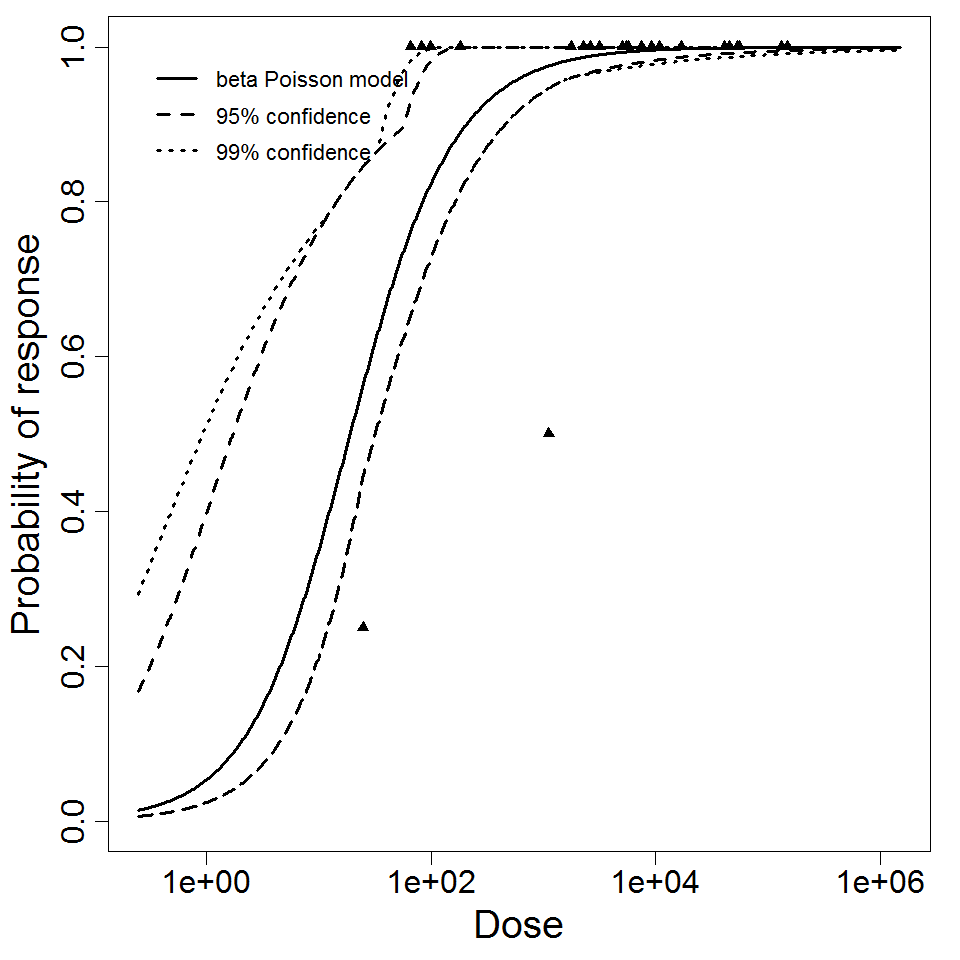
beta Poisson model plot, with confidence bounds around optimized model
# of Doses
24.00
Μodel
N50
1.88E+01
LD50/ID50
1.88E+01
Dose Units
Response
Exposure Route
Contains Preferred Model
a
8.58E-01
Agent Strain
R1
Experiment ID
300
Host type