General Overview
According to Kitajima et al.[1] and Watanabe et al.[2] influenza A viruses are members of the family Orthomyxoviridae, which is comprised of enveloped viruses with segmented, negative-sense RNA genomes. Based on the antigenicity of the two surface glycoproteins, hemagglutinin (HA) and neuraminidase (NA), influenza A viruses are currently divided into 16 HA and 9 NA subtypes, designated as H1-H16 and N1-N9. Over the past century, viruses of the H1N1, H2N2, H3N2, and H1N2 subtypes have circulated in humans. Additionally, new subtypes such as H5N1 and H7N9 have been recently isolated from human as well as poultry. Influenza A virus is one of the most common causes of human respiratory infections and the most significant because they cause high morbidity and mortality. Transmission of influenza can be achieved via environmental reservoirs or human-to-human communication.
Summary Data
Murphy et al. [3] intranasally challenged adult human volunteers with influenza A (H1N1) California/10/78 cold-adapted viruses. Infection was defined as virus recovery and/or antibody response.
Murphy et al.[4] challenged adult human volunteers with influenza A (H3N2) Washington/897/80 avian-human reassortant viruses via the intranasal route. Infection was defined as virus isolation and/or antibody response.
Fan et al.[5] exposed six-week-old SPF BALB/c mice (five mice/dose) intranasally with a highly pathogenic avian influenza A (H5N1) virus (DKGX/35 strain).
| D | # of Doses | Agent Strain | Dose Units | Host type | Μodel | Optimized parameters | Response type | Reference |
|---|---|---|---|---|---|---|---|---|
| 257 | 4 | H1N1,A/California/10/78 attenuated strain | TCID50 | human | beta-Poisson | a = 9.04E-01
LD50/ID50 = 1.25E+06 |
infection | Murphy et al.[4] |
| 257, 258 | 9 | H1N1,A/California/10/78 attenuated strain,H3N2,A/Washington/897/80 attenuated strain | TCID50 | human | beta-Poisson | a = 5.81E-01
LD50/ID50 = 9.45E+05 |
infection |
Murphy et al.[3] |
| 258 | 5 | H3N2,A/Washington/897/80 attenuated strain | TCID50 | human | beta-Poisson | a = 4.29E-01
LD50/ID50 = 6.66E+05 |
infection | Fan et al.[5] |
| 259 | 6 | H5N1, DKGX/35 strain | EID50 | mice | exponential |
k = 1.09E-02 LD50/ID50 = 6.38E+01 |
death | DeDiego et al.[6] |
Optimization Output for Exp. 257:
Experiment ID: 257
# of Doses: 4
Agent Strain: H1N1,A/California/10/78 attenuated strain
Dose Units: TCID50
Host type: human
Μodel: beta-Poisson
Optimized parameters:
a = 9.04E-01
LD50/ID50 = 1.25E+06
N50 = 1.25E+06
|
|
||||||||||||||||||||||
|
||||||||||||||||||||||||||||||

Parameter scatter plot for beta Poisson model ellipses signify the 0.9, 0.95 and 0.99 confidence of the parameters.

beta Poisson model plot, with confidence bounds around optimized model
Optimization Output for Exp. 257, 258:
Best Fit
Experiment ID: 257, 258
# of Doses: 9
Agent Strain: H1N1,A/California/10/78 attenuated strain,H3N2,A/Washington/897/80 attenuated strain
Dose Units: TCID50
Host type: human
Μodel: beta-Poisson
Optimized parameters:
a = 5.81E-01
LD50/ID50 = 9.45E+05
N50 = 9.45E+05
|
|
||||||||||||||||||||||
|
||||||||||||||||||||||||||||||

Parameter scatter plot for beta Poisson model ellipses signify the 0.9, 0.95 and 0.99 confidence of the parameters.

beta Poisson model plot, with confidence bounds around optimized model
Optimization Output for Exp. 258:
Experiment ID: 258
# of Doses: 5
Agent Strain: H3N2,A/Washington/897/80 attenuated strain
Dose Units: TCID50
Host type: human
Μodel: beta-Poisson
Optimized parameters:
a = 4.29E-01
LD50/ID50 = 6.66E+05
N50 = 6.66E+05
|
|
||||||||||||||||||||||
|
||||||||||||||||||||||||||||||

Parameter scatter plot for beta Poisson model ellipses signify the 0.9, 0.95 and 0.99 confidence of the parameters.

beta Poisson model plot, with confidence bounds around optimized model
Optimization Output for Exp. 259:
Experiment ID: 259
# of Doses: 6
Agent Strain: H5N1, DKGX/35 strain
Dose Units: EID50
Host type: mice
Μodel: exponential
Optimized parameters:
k = 1.09E-02
LD50/ID50 = 6.38E+01
|
|
||||||||||||||||||||||
|
||||||||||||||||||||||||||||||||||||||

Parameter histogram for exponential model (uncertainty of the parameter)

Exponential model plot, with confidence bounds around optimized model
Recommended Model
It is recommended that the pooled experiments 257 and 258 should be used as the best dose-response model. Both strains are common in human outbreaks. The pooling narrows the range of the confidence region of the parameter estimates and enhances the statistical precision.
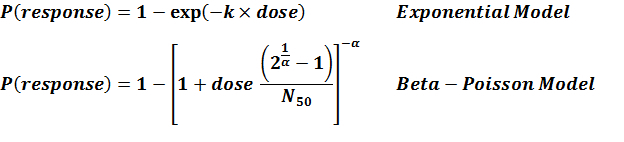
Advanced Dose Response Model
Incorporating the time postinoculation into the classical dose-response models for microbial infection generates a class of time-dose-response (TDR) models. The parameter k in the exponential dose-response model (equation 1) and the parameter N50 in the beta-Poisson model (equation 2) were set equal to functions of time that represent in vivo bacterial kinetics. Equations 1-2 with candidate G(t; θ,…) were fit to the time-dependent dose response data from experiment 259. The beta-Poisson TDR model (equation 2) incorporating an exponential-inverse-power distribution provided the best fit to the data. In the following figure, the best TDR models are plotted to compare with the observed mortalities, according to Kitajima et al. (under review)[1]. As shown, the clear difference between the different times postinoculation gives a visible representation of the quantified results that the modification added to the classical models has a substantial effect on the dose response.

The best-fit TDR model (curves) compared to observed mortalities against doses (symbols) from experiment 259.

Summary
The pooling results indicate that the human responses to HIN1 and H3N2 viruses may have similar patterns.
References
- Citekey 1268 not found
- Citekey 1269 not found
- (1984). Dose Response of Cold-Adapted, Reassortant Influenza A/California/10/78 Virus (H1N1) in Adult Volunteers. Journal of Infectious Diseases. 149, 5.
- (1985). Dose Response of Influenza A/Washington/897/80 (H3N2) Avian-Human Reassortant Virus in Adult Volunteers. The Journal of Infectious Diseases. 152, 1.
- (2009). Two amino acid residues in the matrix protein M1 contribute to the virulence difference of H5N1 avian influenza viruses in mice. Virology.. 384, 1.
- (2008). Pathogenicity of severe acute respiratory coronavirus deletion mutants in hACE-2 transgenic mice. Virology. 376, 379–389.