| Experiment ID |
86
|
|---|---|
| Pathogen | |
| Agent Strain |
Vollum
|
| Contains Preferred Model |
No
|
| Reference |
Druett, H. A., Henderson, D. W., Packman, L. ., & Peacock, S. . (1953). Studies on respiratory infection. The Journal of Hygiene, 51, 3. |
| Exposure Route |
inhalation
|
| Response |
death
|
| Host type |
monkey
|
|---|---|
| # of Doses |
9.00
|
| Dose Units |
spores
|
| Μodel |
exponential
|
| k |
7.16E-06
|
| LD50/ID50 |
9.69E+04
|
Description
|
|
||||||||||||||||||||||
|
||||||||||||||||||||||||||||||||||||||

Parameter histogram for exponential model (uncertainty of the parameter)
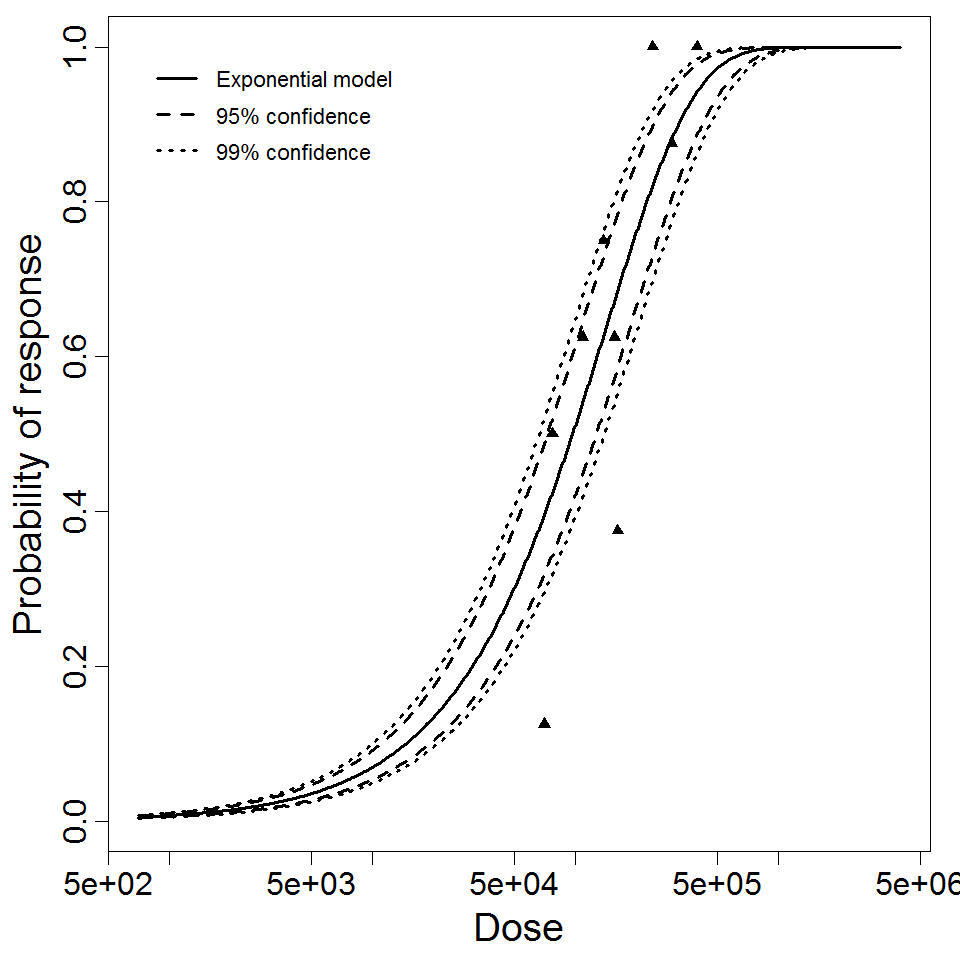
Exponential model plot, with confidence bounds around optimized model