| Experiment ID |
87
|
|---|---|
| Pathogen | |
| Agent Strain |
Vollum
|
| Contains Preferred Model |
Yes
|
| Reference |
June, R. ., Ferguson, W. ., & Worfel, M. . (1953). Experiments in feeding adult volunteers with Escherichia coli 55, B5, a coliform organism associated with infant diarrhea. American Journal of Hygiene, 57(2). https://doi.org/10.1093/oxfordjournals.aje.a119570 |
| Exposure Route |
inhalation
|
| Response |
death
|
| Host type |
guinea pig
|
|---|---|
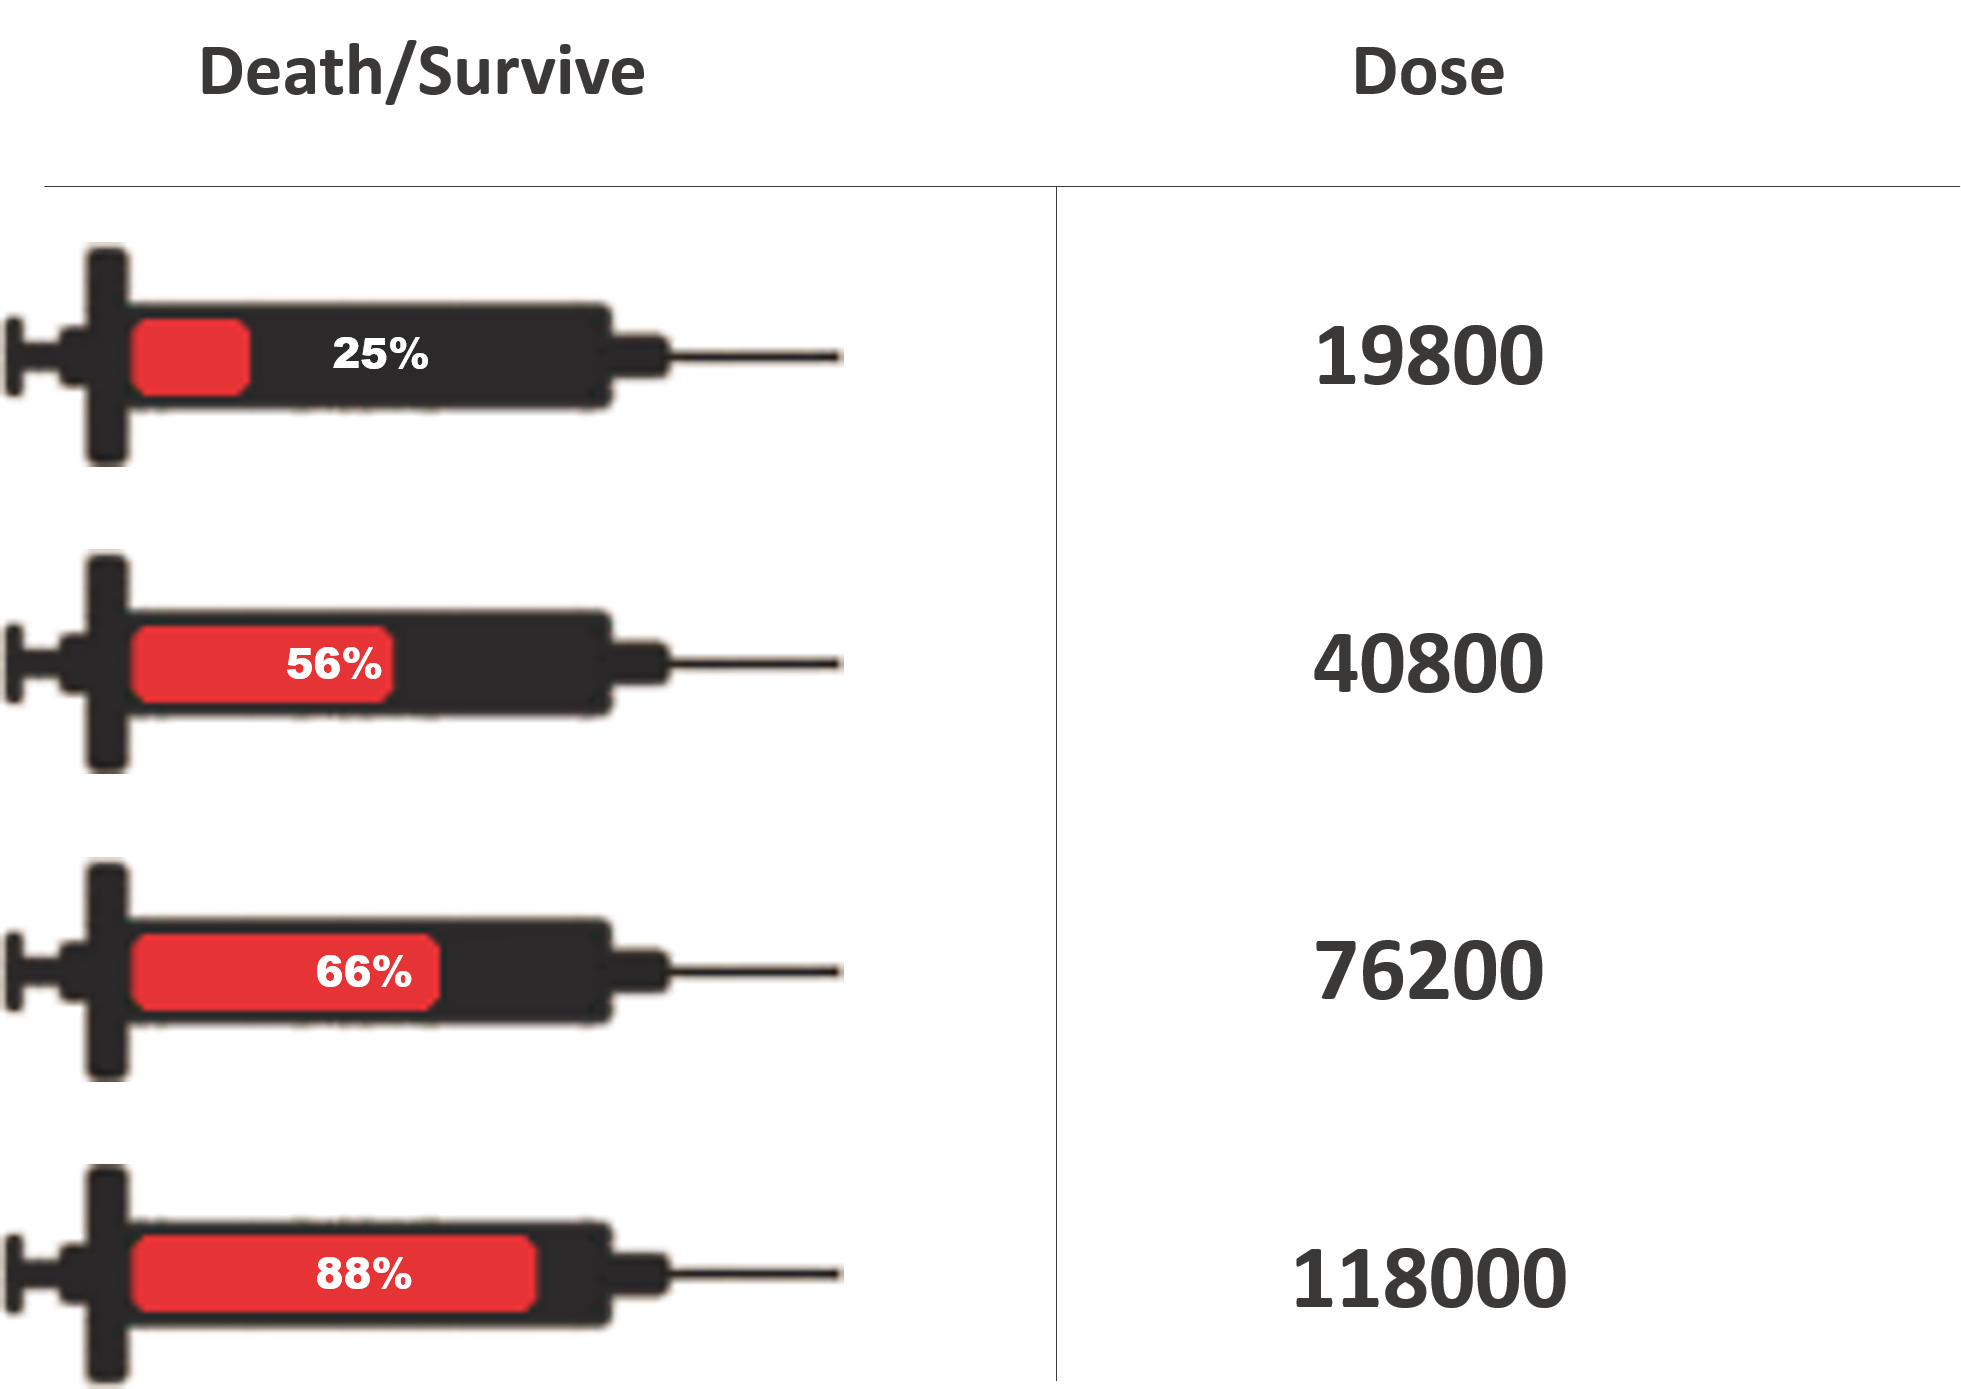
| # of Doses |
4.00
|
| Dose Units |
spores
|
| Μodel |
exponential
|
| k |
1.65E-05
|
| LD50/ID50 |
4.2E+04
|
Description
|
|
||||||||||||||||||||||
|
||||||||||||||||||||||||||||||||||||||

Parameter histogram for exponential model (uncertainty of the parameter)
Exponential model plot, with confidence bounds around optimized model