| Experiment ID |
106
|
|---|---|
| Pathogen | |
| Agent Strain |
strain A3249
|
| Contains Preferred Model |
Yes
|
| Reference |
Black, R. E., Levine, M. M., Clements, M. L., Hughes, T. P., & Blaser, M. J. (1988). Experimental Campylobacter jejuni Infection in Humans. Journal of Infectious Diseases, 157, 3. https://doi.org/10.1093/infdis/157.3.472 |
| Exposure Route |
oral
|
| Response |
infection
|
| Host type |
human
|
|---|---|
| # of Doses |
6.00
|
| Dose Units |
CFU
|
| Μodel |
beta-Poisson
|
| a |
1.44E-01
|
| N50 |
8.9E+02
|
| LD50/ID50 |
8.9E+02
|
Description
|
|
||||||||||||||||||||||
|
||||||||||||||||||||||||||||||
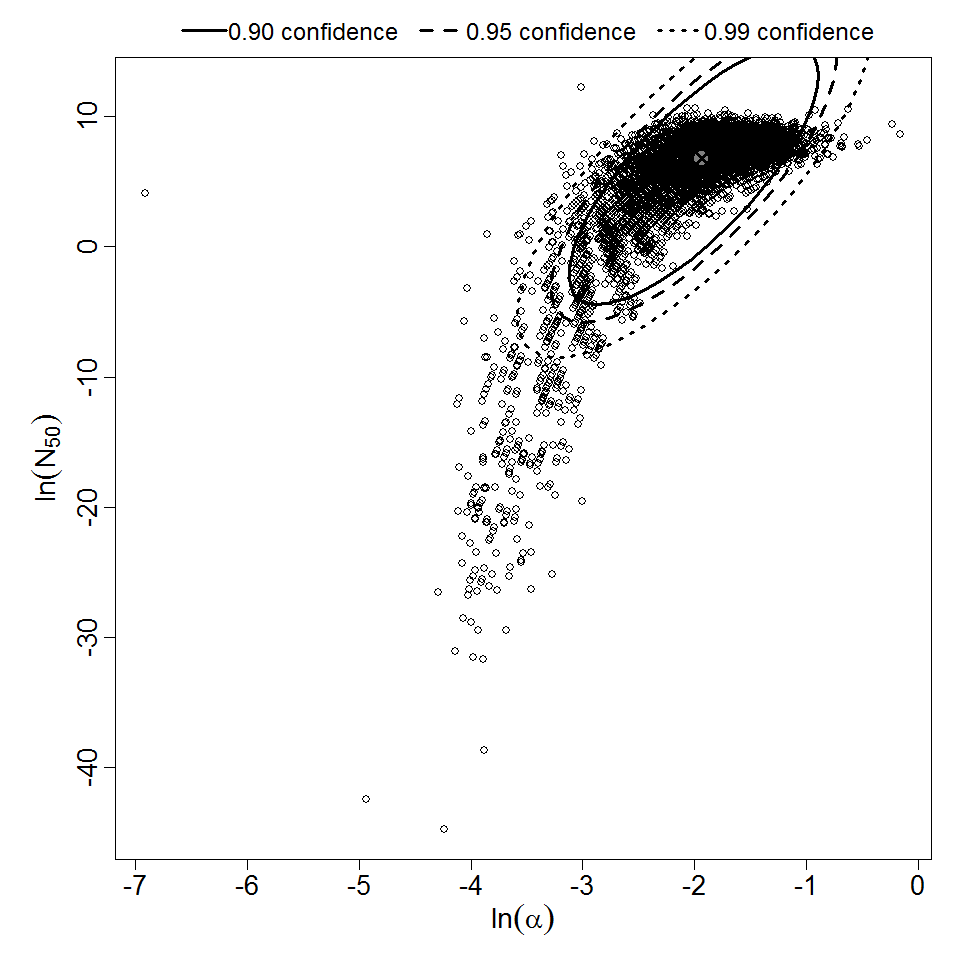
Parameter scatter plot for beta Poisson model ellipses signify the 0.9, 0.95 and 0.99 confidence of the parameters.
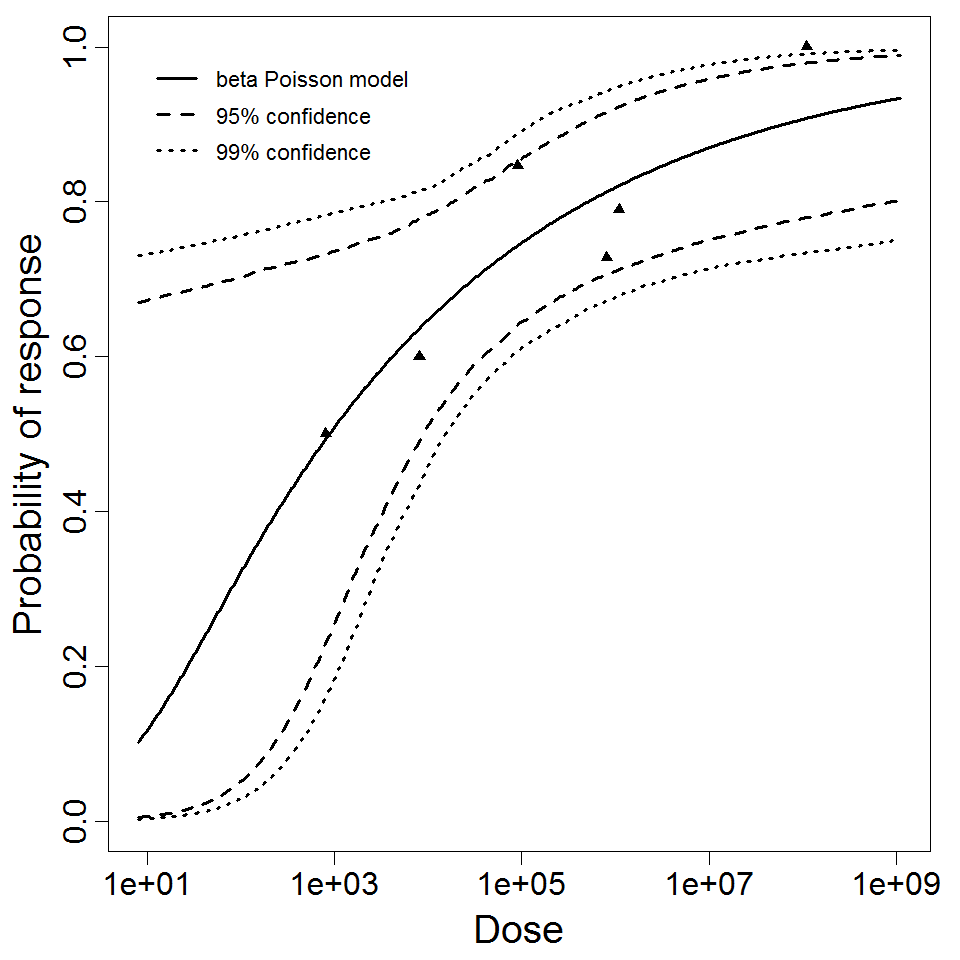
beta Poisson model plot, with confidence bounds around optimized model