| Experiment ID |
46
|
|---|---|
| Pathogen | |
| Agent Strain |
From an infected human
|
| Contains Preferred Model |
Yes
|
| Reference |
Rendtorff, R. C. (1954). The experimental transmission of human intestinal protozoan parasites. II. Giardia lamblia cysts given in capsules. American Journal of Hygiene, 59, 2. Retrieved from https://academic.oup.com/aje/article-abstract/59/2/196/89318?redirectedFrom=PDF |
| Exposure Route |
oral
|
| Response |
infection
|
| Host type |
human
|
|---|---|
| # of Doses |
8.00
|
| Dose Units |
Cysts
|
| Μodel |
exponential
|
| k |
1.99E-02
|
| LD50/ID50 |
3.48E+01
|
Description
|
|
||||||||||||||||||||||
|
||||||||||||||||||||||||||||||||||||||
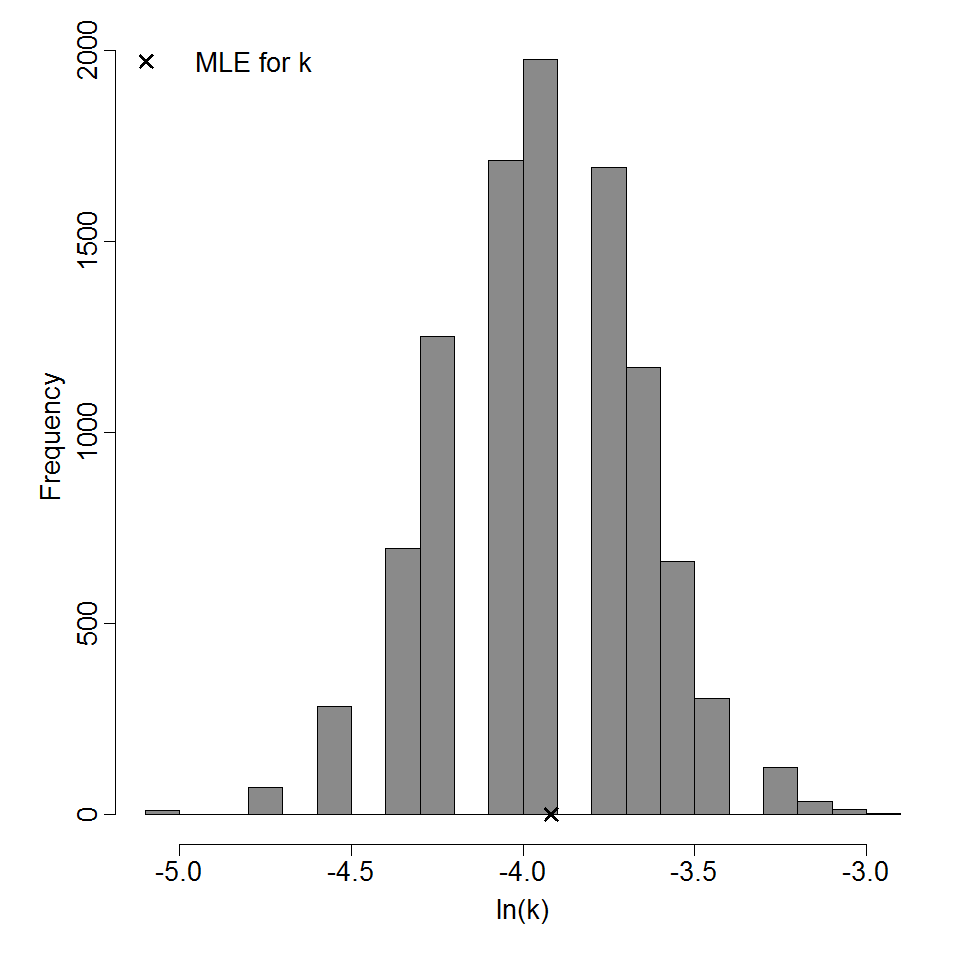
Parameter histogram for exponential model (uncertainty of the parameter)

Exponential model plot, with confidence bounds around optimized model