| Experiment ID |
13
|
|---|---|
| Pathogen | |
| Agent Strain |
Josiah strain
|
| Contains Preferred Model |
Yes
|
| Reference |
Jahrling, P. B., Smith, S. ., Hesse, R. A., & Rhoderick, J. B. (1982). Pathogenesis of Lassa virus infection in guinea pigs. Infection and Immunity, 37, 2. Retrieved from http://iai.asm.org/content/37/2/771.abstract |
| Exposure Route |
subcutaneous
|
| Response |
death
|
| Host type |
guinea pig
|
|---|---|
| # of Doses |
6.00
|
| Dose Units |
PFU
|
| Μodel |
exponential
|
| k |
2.95E+00
|
| LD50/ID50 |
2.35E-01
|
Description
|
|
||||||||||||||||||||||
|
||||||||||||||||||||||||||||||||||||||

Parameter histogram for exponential model (uncertainty of the parameter)
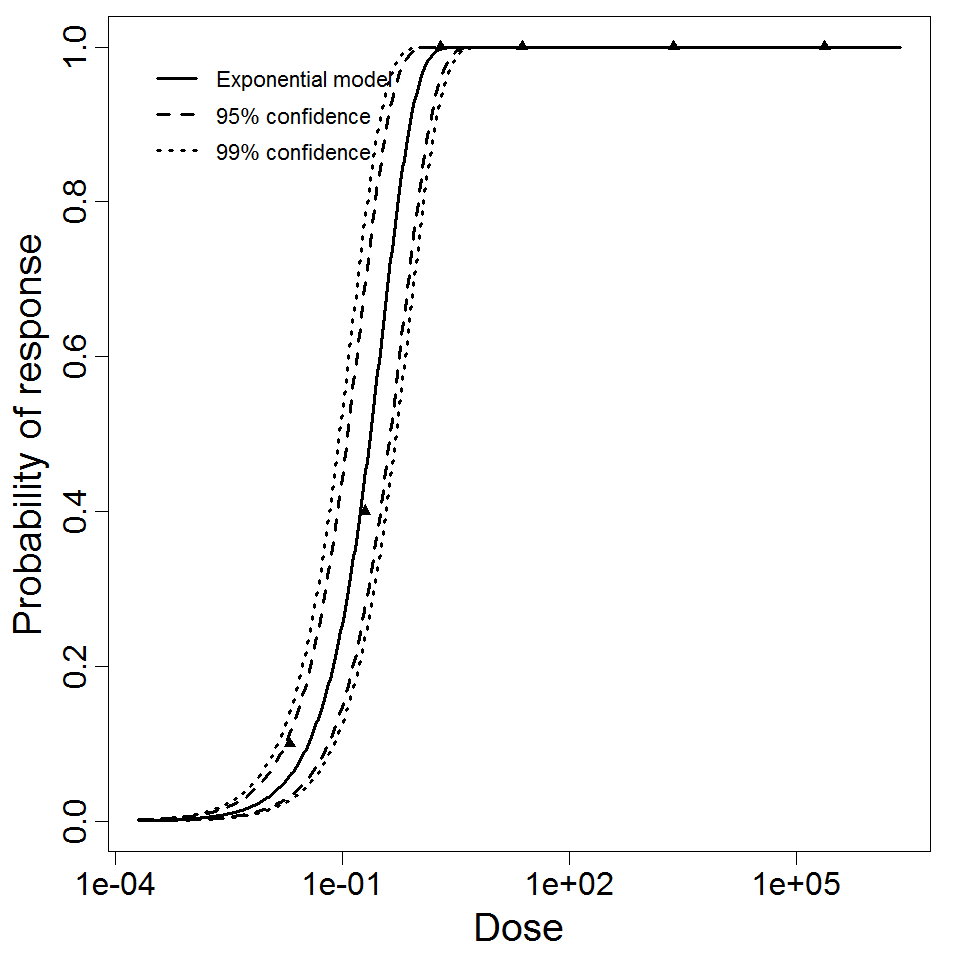
Exponential model plot, with confidence bounds around optimized model