Rhesus monkey Data [1]
| Dose | 
Dead | 
Survived | 
Total | 
 
| 25 | 
1 | 
3 | 
4 | 
 
| 66 | 
2 | 
0 | 
2 | 
 
| 83 | 
2 | 
0 | 
2 | 
 
| 99 | 
1 | 
1 | 
2 | 
 
| 182 | 
3 | 
4 | 
7 | 
 
| 1111 | 
1 | 
1 | 
2 | 
 
| 1774 | 
1 | 
1 | 
2 | 
 
| 2287 | 
1 | 
1 | 
2 | 
 
| 2586 | 
2 | 
0 | 
2 | 
 
| 3166 | 
1 | 
1 | 
2 | 
 
| 5055 | 
6 | 
1 | 
7 | 
 
| 5519 | 
2 | 
0 | 
2 | 
 
| 5652 | 
2 | 
0 | 
2 | 
 
| 5669 | 
1 | 
0 | 
1 | 
 
| 7459 | 
2 | 
0 | 
2 | 
 
| 9199 | 
1 | 
1 | 
2 | 
 
| 10774 | 
2 | 
0 | 
2 | 
 
| 16790 | 
1 | 
1 | 
2 | 
 
| 41023 | 
2 | 
0 | 
2 | 
 
| 45498 | 
1 | 
2 | 
3 | 
 
| 53206 | 
2 | 
0 | 
2 | 
 
| 55195 | 
2 | 
0 | 
2 | 
 
| 131771 | 
1 | 
1 | 
2 | 
 
| 149175 | 
2 | 
0 | 
2 | 
 
 
 | 
 
Goodness of fit and model selection
| Model | 
Deviance | 
Δ | 
Degrees  
						of freedom | 
χ20.95,1  
						p-value | 
χ20.95,m-k  
						p-value | 
 
| Exponential | 
137 | 
113 | 
23 | 
3.84  
						0 | 
35.2  
						0 | 
 
| Beta Poisson | 
24 | 
22 | 
33.9  
						0.345 | 
 
| Beta-Poisson fits better than exponential; cannot reject good fit for beta-Poisson. | 
 
 
 | 
 
Optimized parameters for the beta-Poisson model, from 10000 bootstrap iterations
| Parameter | 
MLE estimate | 
Percentiles | 
 
| 0.5% | 
2.5% | 
5% | 
95% | 
97.5% | 
99.5% | 
 
| α | 
1.45E-01 | 
1.82E-02 | 
2.72E-02 | 
4.15E-02 | 
2.59E-01 | 
2.87E-01 | 
3.49E-01 | 
 
| N50 | 
5.01E+01 | 
6.71E-12 | 
6.31E-07 | 
2.86E-03 | 
2.62E+02 | 
3.28E+02 | 
4.87E+02 | 
 
 
 | 
 

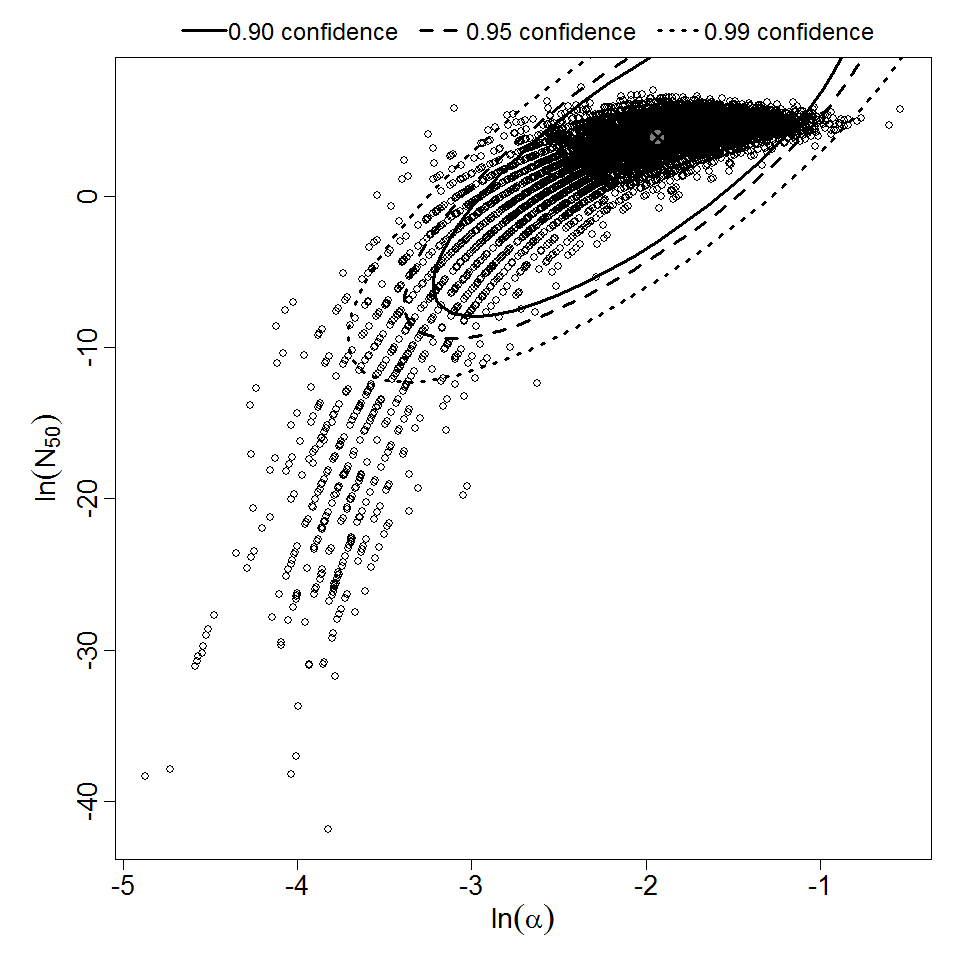
Parameter scatter plot for beta Poisson model ellipses signify the 0.9, 0.95 and 0.99 confidence of the parameters.

beta Poisson model plot, with confidence bounds around optimized model
References