| Experiment ID |
70
|
|---|---|
| Pathogen | |
| Contains Preferred Model |
No
|
| Reference |
Ward, R. L., Bernstein, D. I., Young, E. C., Sherwood, J. R., Knowlton, D. R., & Schiff, G. M. (1986). Human Rotavirus Studies in Volunteers: Determination of Infectious Dose and Serological Response to Infection. Journal of Infectious Diseases, 154, 5. https://doi.org/10.1093/infdis/154.5.871 |
| Exposure Route |
oral
|
| Host type |
human
|
||||||||||||||||||||
|---|---|---|---|---|---|---|---|---|---|---|---|---|---|---|---|---|---|---|---|---|---|
| # of Doses |
8.00
|
||||||||||||||||||||
| Dose Units |
FFU
|
||||||||||||||||||||
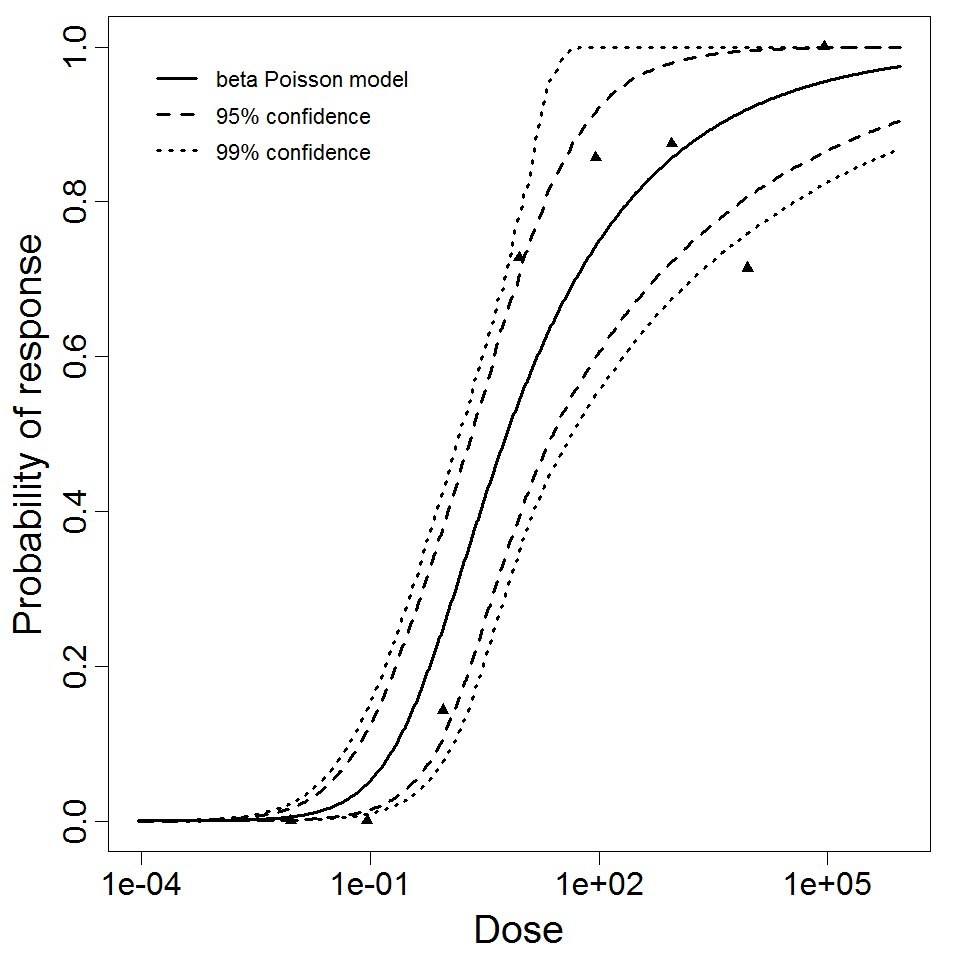
| Μodel |
beta-Poisson
|
||||||||||||||||||||
| a |
2.53E-02
|
||||||||||||||||||||
| k |
6.17E+00
|
||||||||||||||||||||
| LD50/ID50 |
6.17E+00
|
||||||||||||||||||||
| Experiment Dataset |
|
Description
|
| ||||||||||||||||||||||
| ||||||||||||||||||||||||||||||