| Experiment ID |
81, 215
|
|---|---|
| Pathogen | |
| Agent Strain |
M 131
|
| Contains Preferred Model |
No
|
| Reference |
Levine, M. M., DuPont, H. L., Formal, S. B., Hornick, R. B., Takeuchi, A. ., Gangarosa, E. J., … Libonati, J. P. (1973). Pathogenesis of Shigella dysenteriae 1 (Shiga) Dysentery. Journal of Infectious Diseases, 127, 3. |
| Exposure Route |
oral (in milk)
|
| Response |
illness
|
| Host type |
human
|
||||||||||||||||||||
|---|---|---|---|---|---|---|---|---|---|---|---|---|---|---|---|---|---|---|---|---|---|
| # of Doses |
6.00
|
||||||||||||||||||||
| Dose Units |
CFU
|
||||||||||||||||||||
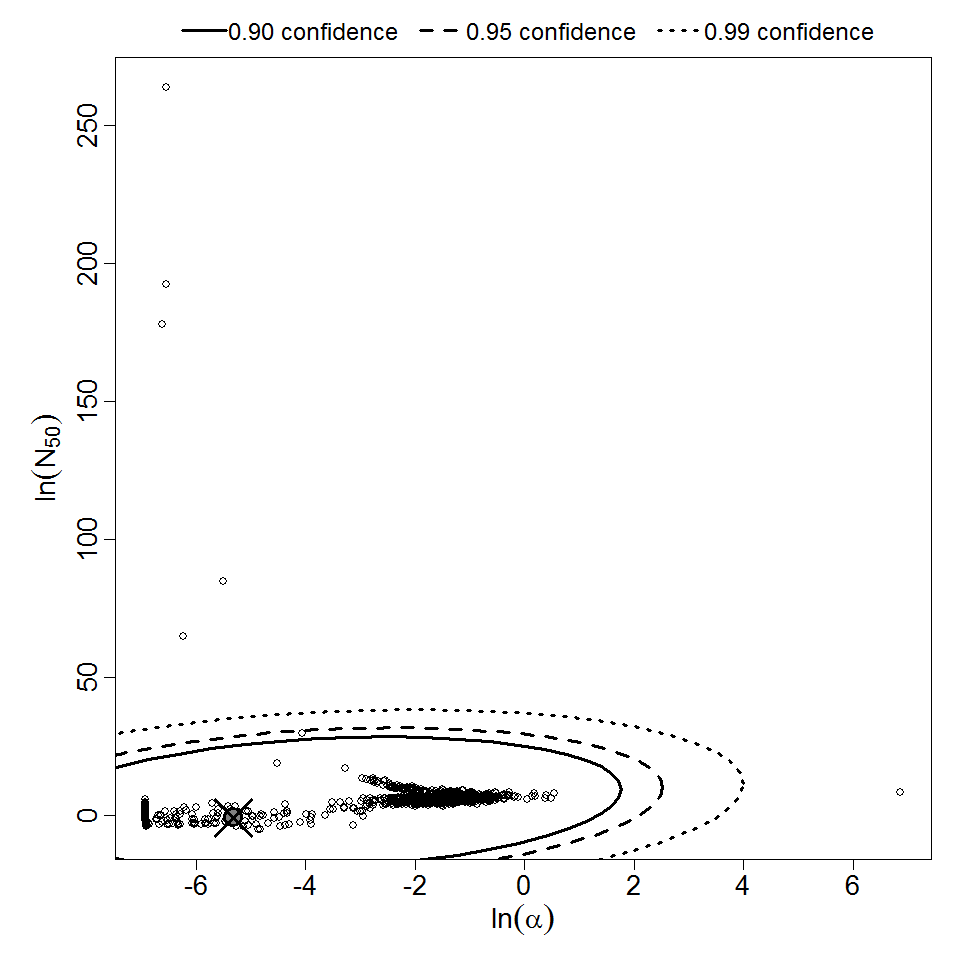
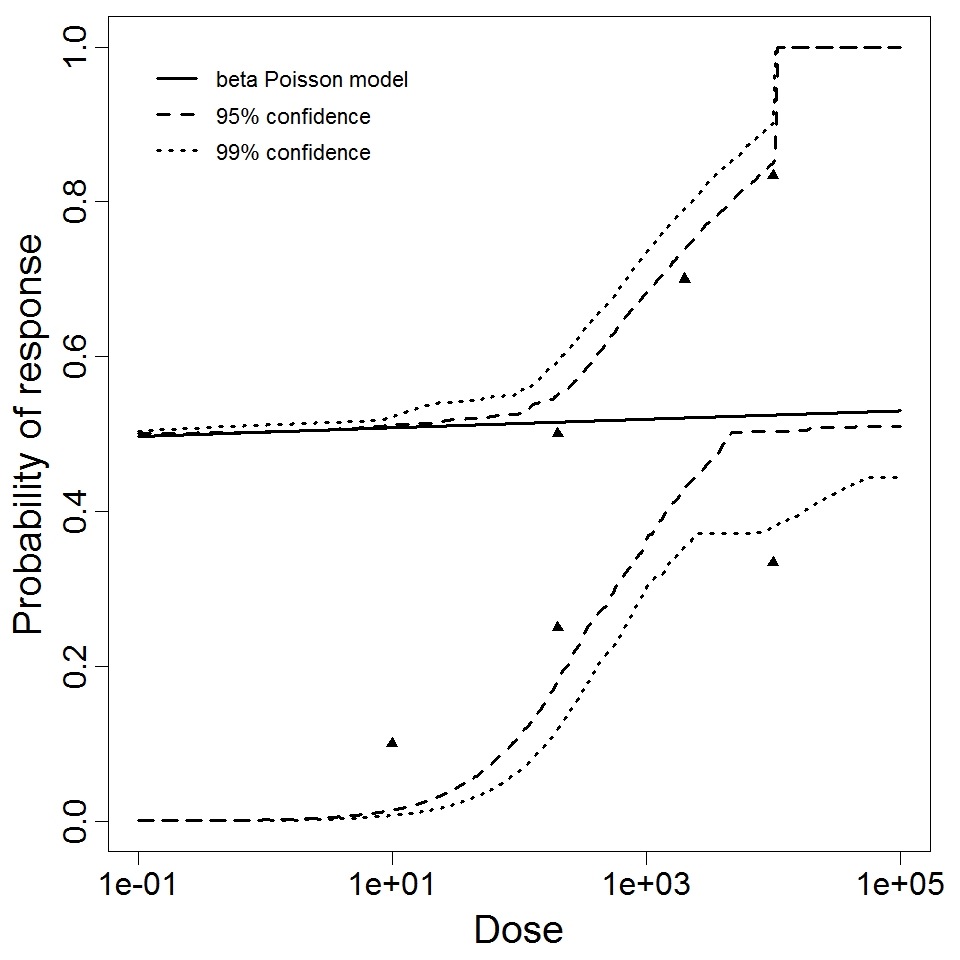
| Μodel |
beta-Poisson
|
||||||||||||||||||||
| a |
4.93E-03
|
||||||||||||||||||||
| N50 |
3.64E-01
|
||||||||||||||||||||
| LD50/ID50 |
3.64E-01
|
||||||||||||||||||||
| Experiment Dataset |
|
Description
|
| ||||||||||||||||||||||
| ||||||||||||||||||||||||||||||