Pseudomonas aeruginosa (Contact lens): Dose Response Models
General Overview
Pseudomonas aeruginosa is a Gram-negative, aerobic rod belonging to the bacterial family Pseudomonadaceae. Like other members of the genus, Pseudomonas aeruginosa is a free-living bacterium, commonly found in soil, water and biofilms. However, it occurs regularly on the surfaces of plants and occasionally on the surfaces of animals. Pseudomonas aeruginosa is an opportunistic pathogen, meaning that it exploits some break in the host defenses to initiate an infection.
| ID | Exposure Route | # of Doses | Agent Strain | Dose Units | Host type | Μodel | LD50/ID50 | Optimized parameters | Response type | Reference |
|---|---|---|---|---|---|---|---|---|---|---|
| 286 | contact lens | 5.00 | ATCC 19660 | CFU | Swiss webster mice | exponential | 7.88E+06 | k = 8.8E-08 | infection (Keratitis) |
Hazlett, L. D., Rosen, D. D., & Berk, R. S. (1978). Age-Related Susceptibility to Pseudomonas aeruginosa Ocular Infections in Mice. Infection and Immunity, 20, 1. |
| 297 | contact lens | 5.00 | CFU | white rabbit | beta-Poisson | 6.57E+03 | a = 3.55E-01 N50 = 6.57E+03 | corneal ulceration |
Lawin-Brüssel, C. A., Refojo, M. F., Leong, F. L., Hanninen, L. ., & Kenyon, K. R. (1993). Effect of Pseudomonas aeruginosa concentration in experimental contact lens-related microbial keratitis. Cornea, 12, 1. |
|
| 297 & 298 | contact lens | 10.00 | CFU | white rabbit | beta-Poisson | 1.85E+04 | a = 1.9E-01 N50 = 1.85E+04 | corneal ulceration |
Lawin-Brüssel, C. A., Refojo, M. F., Leong, F. L., Hanninen, L. ., & Kenyon, K. R. (1993). Effect of Pseudomonas aeruginosa concentration in experimental contact lens-related microbial keratitis. Cornea, 12, 1. |
|
| 298 | contact lens | 5.00 | CFU | white rabbit | beta-Poisson | 1.52E+05 | a = 1.09E-01 N50 = 1.52E+05 | Severe stromal ulceration |
Lawin-Brüssel, C. A., Refojo, M. F., Leong, F. L., Hanninen, L. ., & Kenyon, K. R. (1993). Effect of Pseudomonas aeruginosa concentration in experimental contact lens-related microbial keratitis. Cornea, 12, 1. |
|
|
||||||||||||||||||||||
|
||||||||||||||||||||||||||||||||||||||
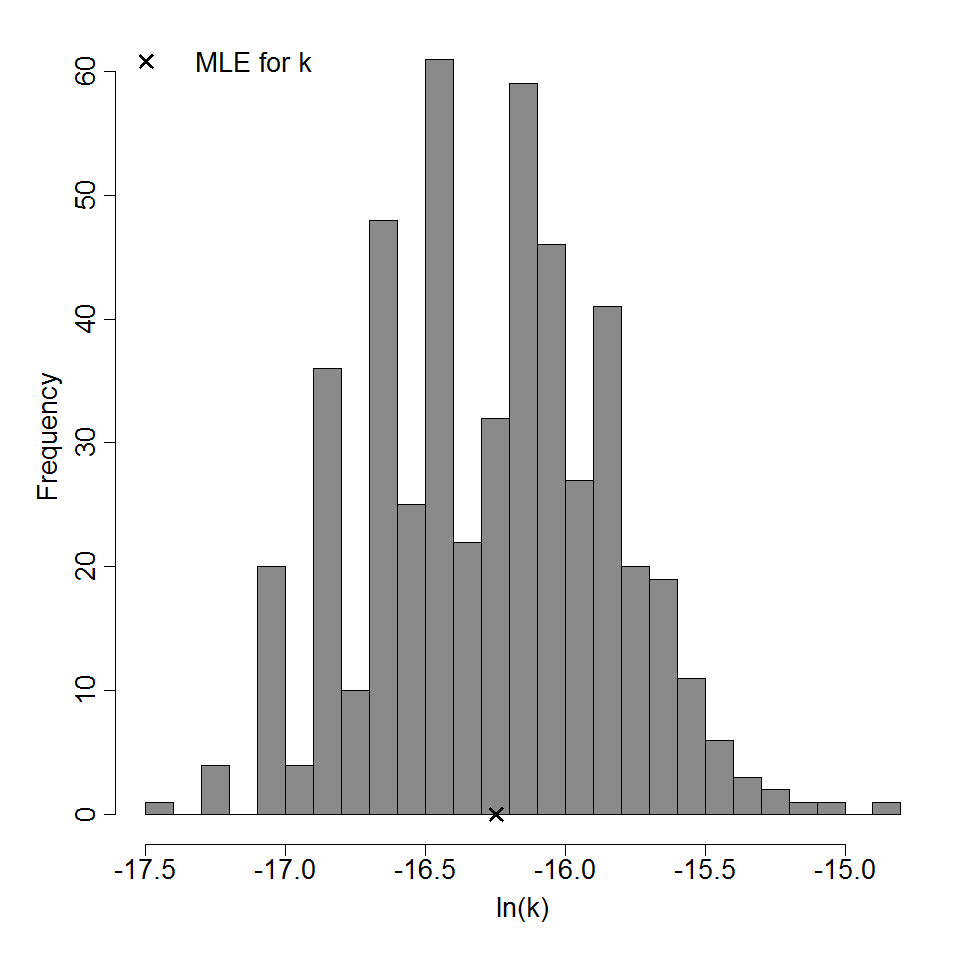
Parameter histogram for exponential model (uncertainty of the parameter)
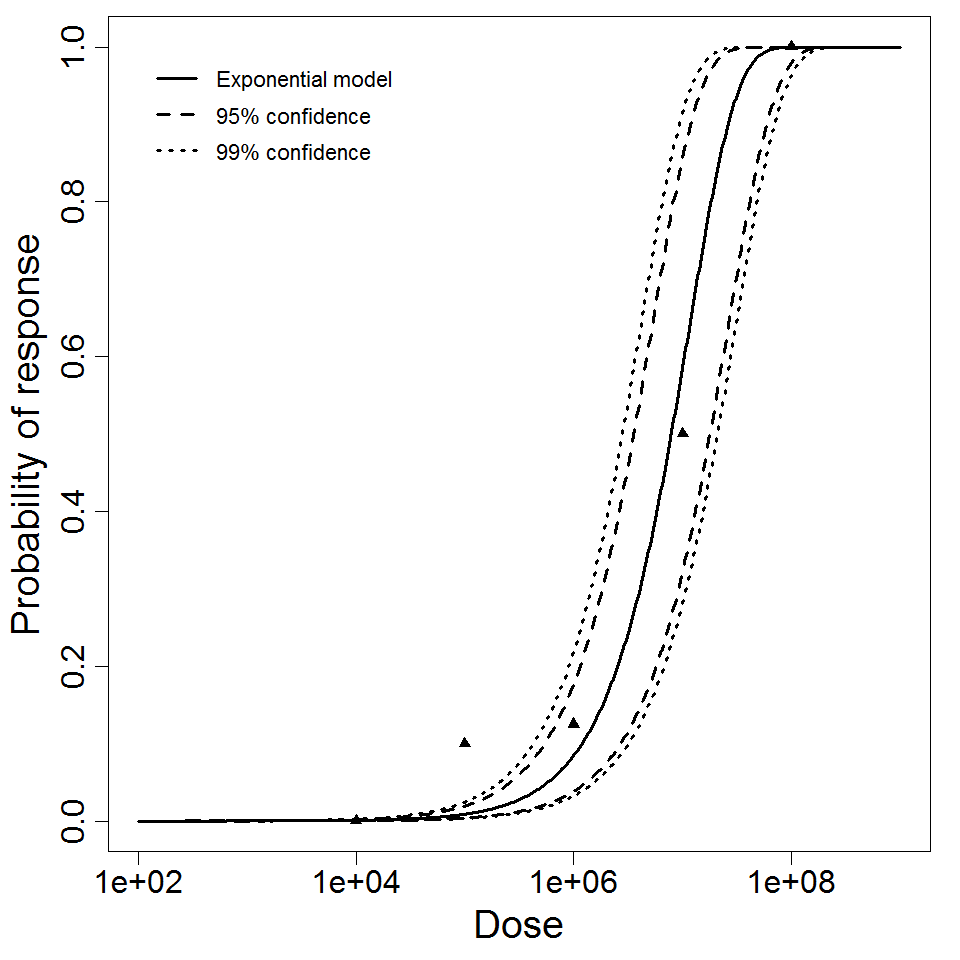
Exponential model plot, with confidence bounds around optimized model
|
|
||||||||||||||||||||||
|
||||||||||||||||||||||||||||||

Parameter histogram for exponential model (uncertainty of the parameter)
Exponential model plot, with confidence bounds around optimized model
|
||||||||||||||||||||||
|
||||||||||||||||||||||||||||||
Parameter histogram for exponential model (uncertainty of the parameter)
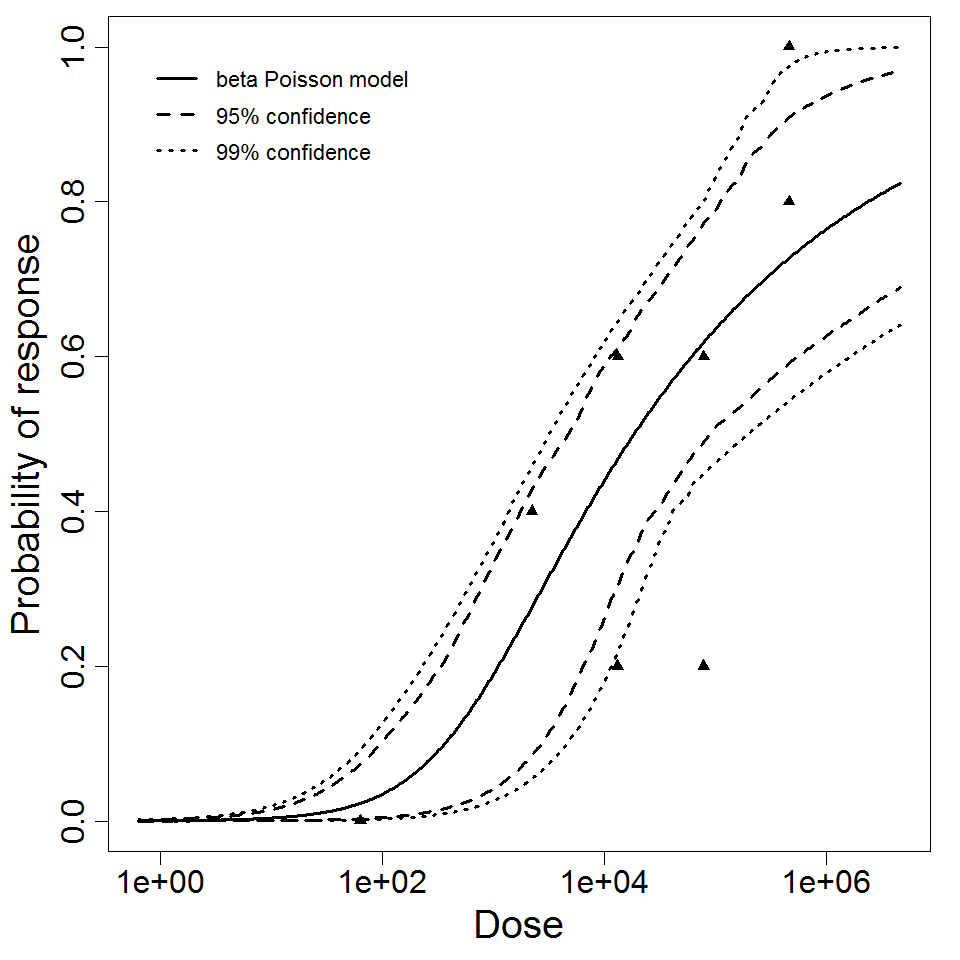
Exponential model plot, with confidence bounds around optimized model
|
|
||||||||||||||||||||||
|
||||||||||||||||||||||||||||||
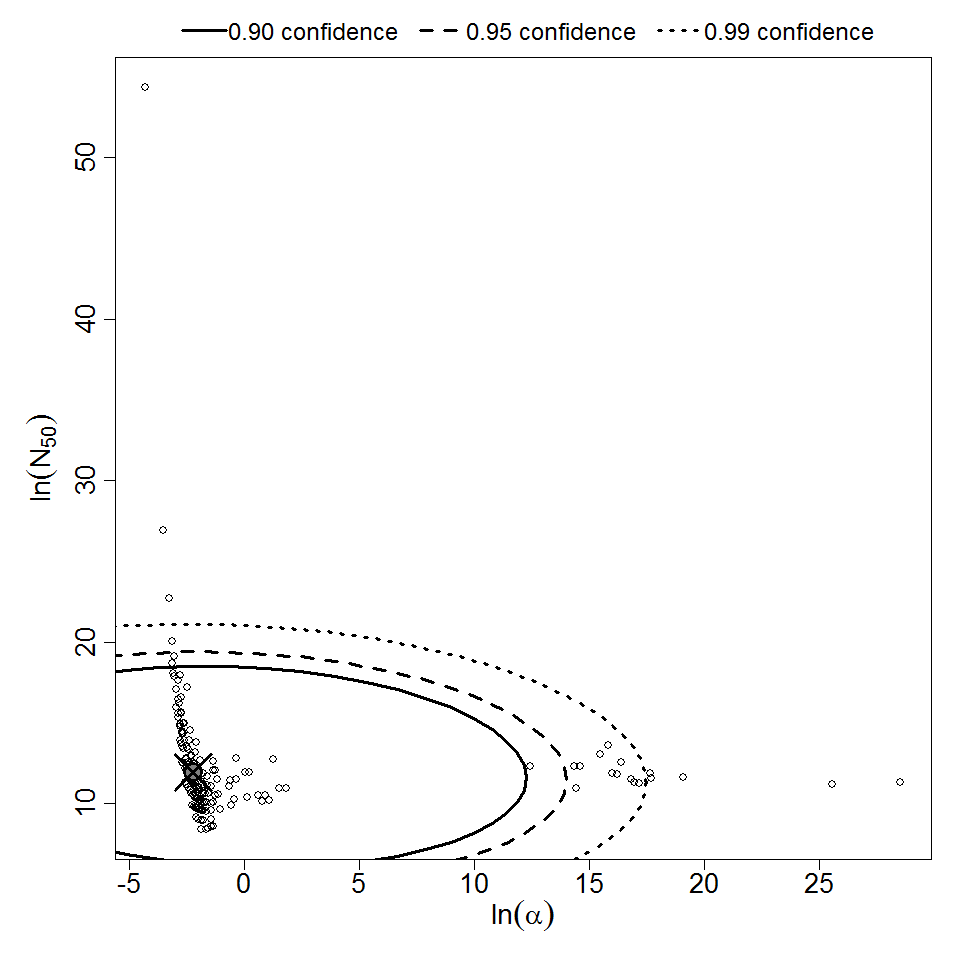
Parameter histogram for exponential model (uncertainty of the parameter)
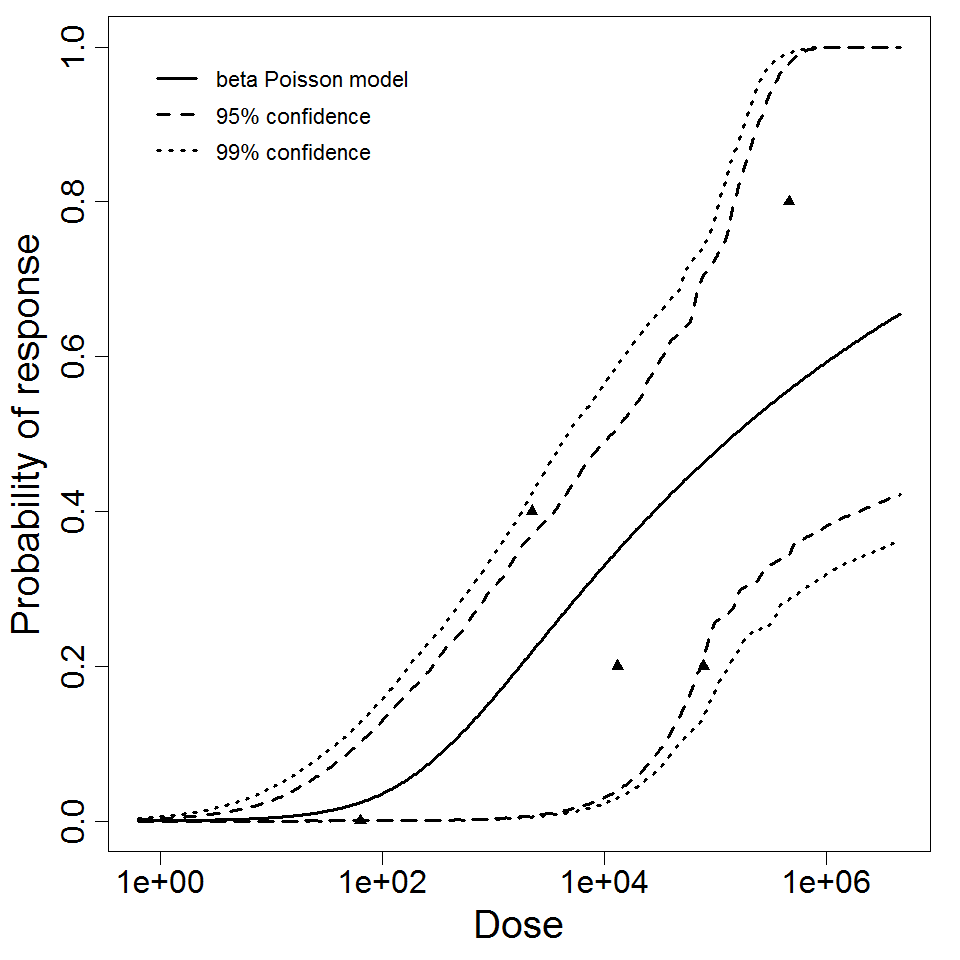
Exponential model plot, with confidence bounds around optimized model