Description
|
|
||||||||||||||||||||||
|
||||||||||||||||||||||||||||||
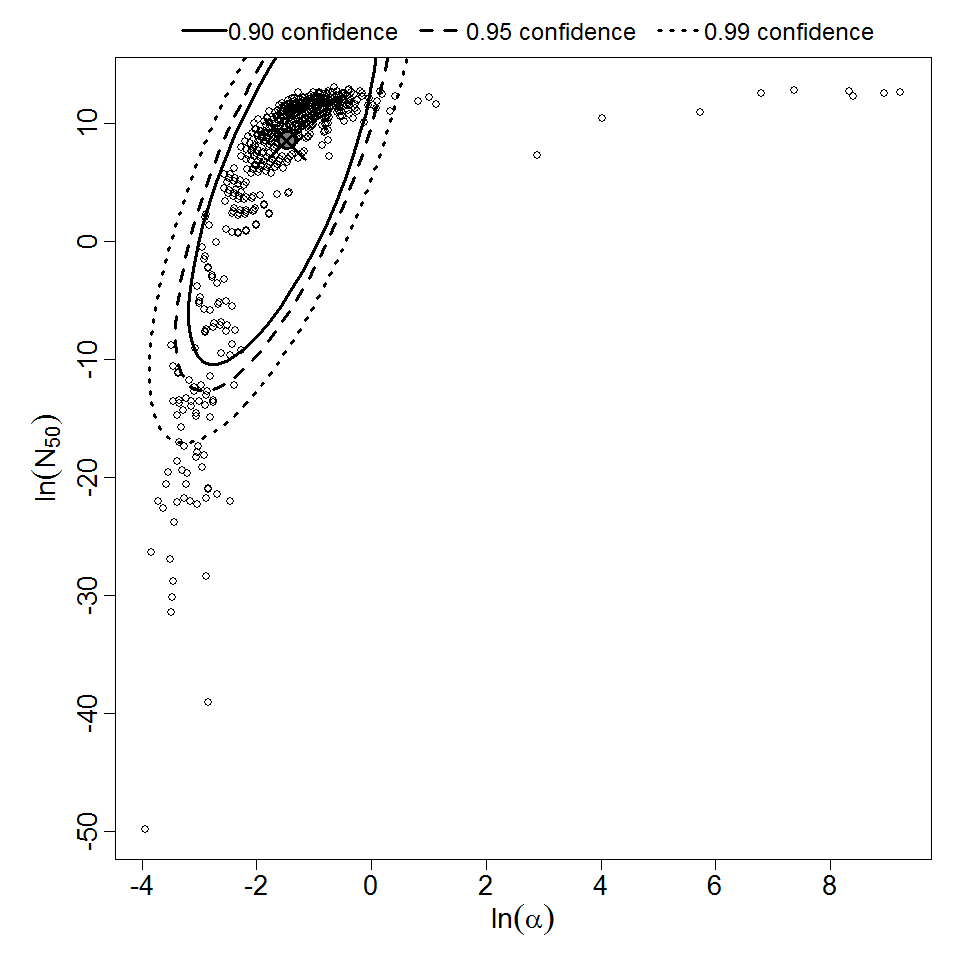
Parameter scatter plot for beta Poisson model ellipses signify the 0.9, 0.95 and 0.99 confidence of the parameters.

beta Poisson model plot, with confidence bounds around optimized model
# of Doses
8.00
Μodel
N50
4.91E+03
LD50/ID50
4.91E+03
Dose Units
Response
Exposure Route
Contains Preferred Model
a
2.3E-01
Agent Strain
strain II
Experiment ID
233
Host type
Description
|
|
||||||||||||||||||||||
|
||||||||||||||||||||||||||||||

Parameter scatter plot for beta Poisson model ellipses signify the 0.9, 0.95 and 0.99 confidence of the parameters.
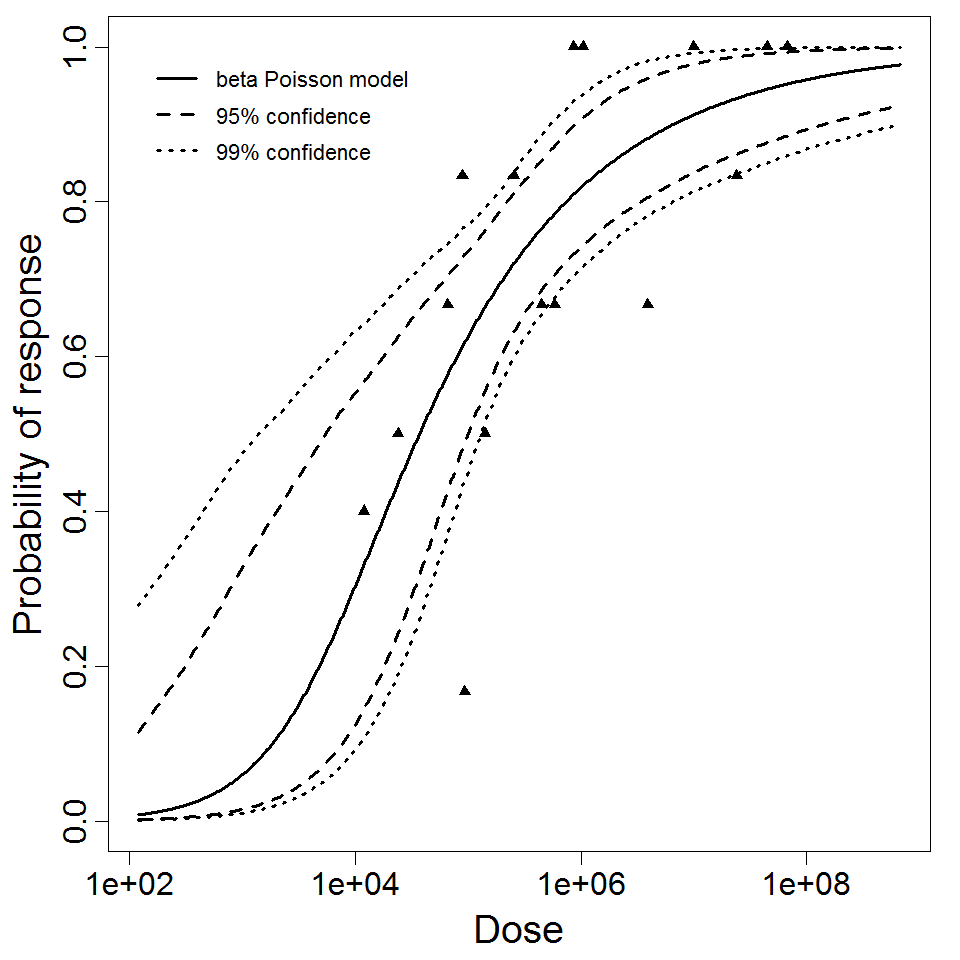
beta Poisson model plot, with confidence bounds around optimized model
# of Doses
16.00
Μodel
N50
3.71E+04
LD50/ID50
3.71E+04
Dose Units
Response
Exposure Route
Contains Preferred Model
a
3.18E-01
Agent Strain
strain I
Experiment ID
232, 233
Host type
Description
|
|
||||||||||||||||||||||
|
||||||||||||||||||||||||||||||

Parameter scatter plot for beta Poisson model ellipses signify the 0.9, 0.95 and 0.99 confidence of the parameters.
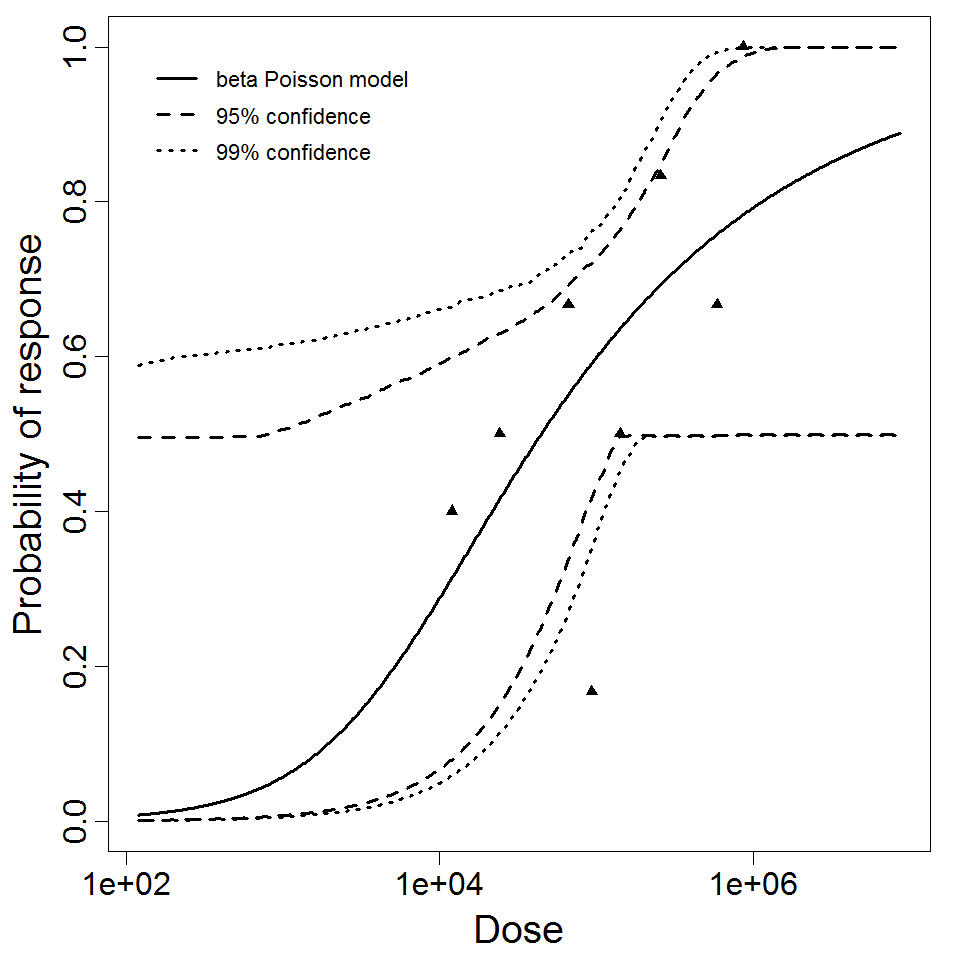
beta Poisson model plot, with confidence bounds around optimized model
# of Doses
8.00
Μodel
N50
4.44E+04
LD50/ID50
4.44E+04
Dose Units
Response
Exposure Route
Contains Preferred Model
a
2.91E-01
Agent Strain
strain I
Experiment ID
232
Host type