Description
|
| ||||||||||||||||||||||
| ||||||||||||||||||||||||||||||
# of Doses
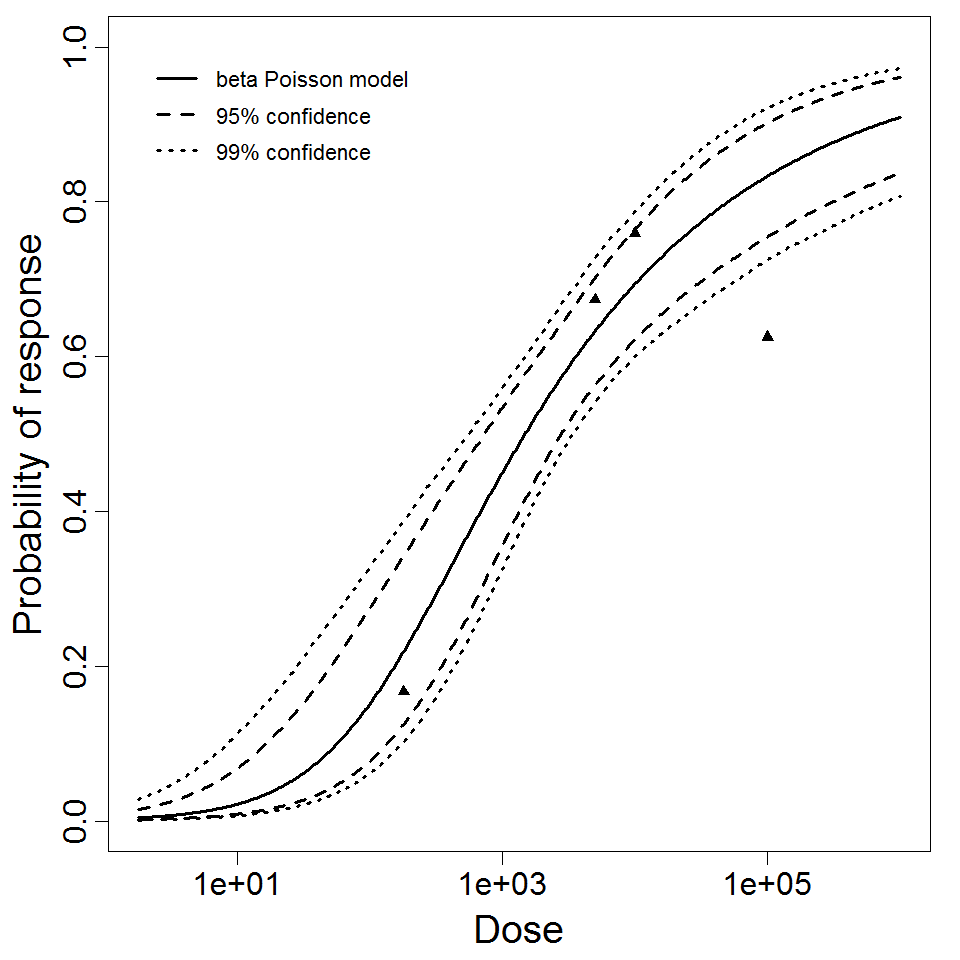
3.00
Μodel
N50
2.11E+06
LD50/ID50
2.11E+06
Dose Units
Response
Exposure Route
Contains Preferred Model
a
1.55E-01
Agent Strain
EIEC 1624
Experiment ID
98
Host type
Experiment Dataset
Description
|
| ||||||||||||||||||||||
| ||||||||||||||||||||||||||||||
# of Doses
7.00
Μodel
N50
1.78E+05
LD50/ID50
1.78E+05
Dose Units
Response
Exposure Route
Contains Preferred Model
a
3.75E-01
Agent Strain
ETEC B7A
Experiment ID
96, 100, 166
Host type
Experiment Dataset
Description
|
| ||||||||||||||||||||||
| ||||||||||||||||||||||||||||||

# of Doses
4.00
Μodel
N50
1.48E+03
LD50/ID50
1.48E+03
Dose Units
Response
Exposure Route
Contains Preferred Model
a
2.65E-01
Agent Strain
2a (strain 2457T)
Experiment ID
83
Host type
Experiment Dataset