| Experiment ID |
17
|
|---|---|
| Pathogen | |
| Agent Strain |
KHW
|
| Contains Preferred Model |
No
|
| Reference |
Liu, B. ., Koo, G. C., Yap, E. H., Chua, K. L., & Y-h, G. . (2002). Model of Differential Susceptibility to Mucosal Burkholderia pseudomallei Infection. Infection and Immunity, 70, 2. |
| Exposure Route |
intranasal
|
| Response |
infection
|
| Host type |
BALB/c mice
|
||||||||||||||||||||
|---|---|---|---|---|---|---|---|---|---|---|---|---|---|---|---|---|---|---|---|---|---|
| # of Doses |
5.00
|
||||||||||||||||||||
| Dose Units |
CFU
|
||||||||||||||||||||
| Μodel |
exponential
|
||||||||||||||||||||
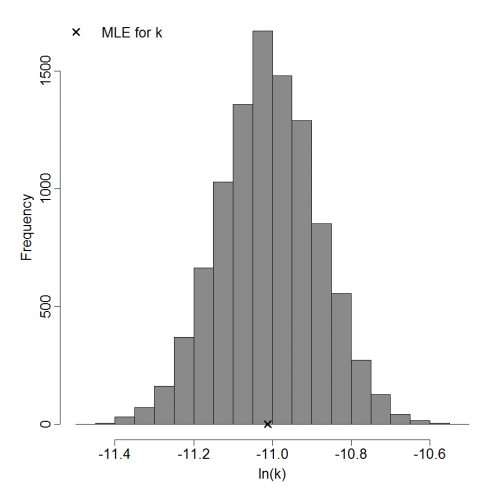
| k |
1.04E-02
|
||||||||||||||||||||
| LD50/ID50 |
6.63E+01
|
||||||||||||||||||||
| Experiment Dataset |
|
Description
|
| ||||||||||||||||||||||
| ||||||||||||||||||||||||||||||||||||||