| Experiment ID |
18,23
|
|---|---|
| Pathogen | |
| Agent Strain |
KHW,316c
|
| Contains Preferred Model |
Yes
|
| Reference |
Brett, P. J., & Woods, D. E. (1996). Structural and immunological characterization of Burkholderia pseudomallei O-polysaccharide-flagellin protein conjugates. Infection and Immunity, 64, 2824–2828. |
| Response |
death
|
| Host type |
C57BL/6 mice and diabetic rat
|
||||||||||||||||||||
|---|---|---|---|---|---|---|---|---|---|---|---|---|---|---|---|---|---|---|---|---|---|
| # of Doses |
10.00
|
||||||||||||||||||||
| Dose Units |
CFU
|
||||||||||||||||||||
| Μodel |
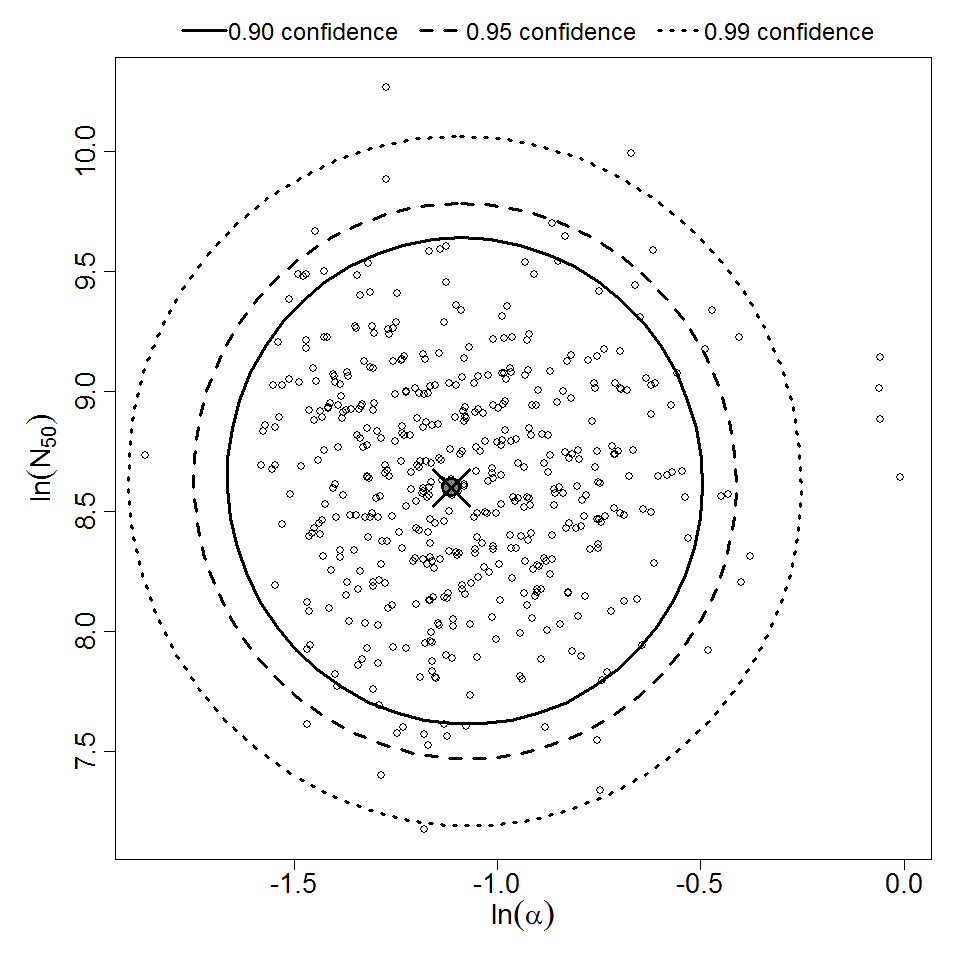
beta-Poisson
|
||||||||||||||||||||
| a |
3.28E-01
|
||||||||||||||||||||
| N50 |
5.43E+03
|
||||||||||||||||||||
| LD50/ID50 |
5.43E+03
|
||||||||||||||||||||
| Experiment Dataset |
|
Description
Optimization Output for experiment 18 and 23 pooled (B. pseudomallei)
|
| ||||||||||||||||||||||
| ||||||||||||||||||||||||||||||