| Experiment ID |
242
|
|---|---|
| Pathogen | |
| Agent Strain |
strain 74/81
|
| Contains Preferred Model |
No
|
| Reference |
Breiman, R. F., & Horwitz, M. A. (1987). Guinea pigs sublethally infected with aerosolized Legionella pneumophila develop humoral and cell-mediated immune responses and are protected against lethal aerosol challenge. A model for studying host defense against lung infections caused by intracellul. The Journal of Experimental Medicine, 165, 3. |
| Exposure Route |
inhalation
|
| Response |
death
|
| Host type |
mice
|
|---|---|
| # of Doses |
4.00
|
| Dose Units |
CFU
|
| Μodel |
exponential
|
| k |
6.48E-05
|
| LD50/ID50 |
1.07E+04
|
Description
|
|
||||||||||||||||||||||
|
||||||||||||||||||||||||||||||||||||||
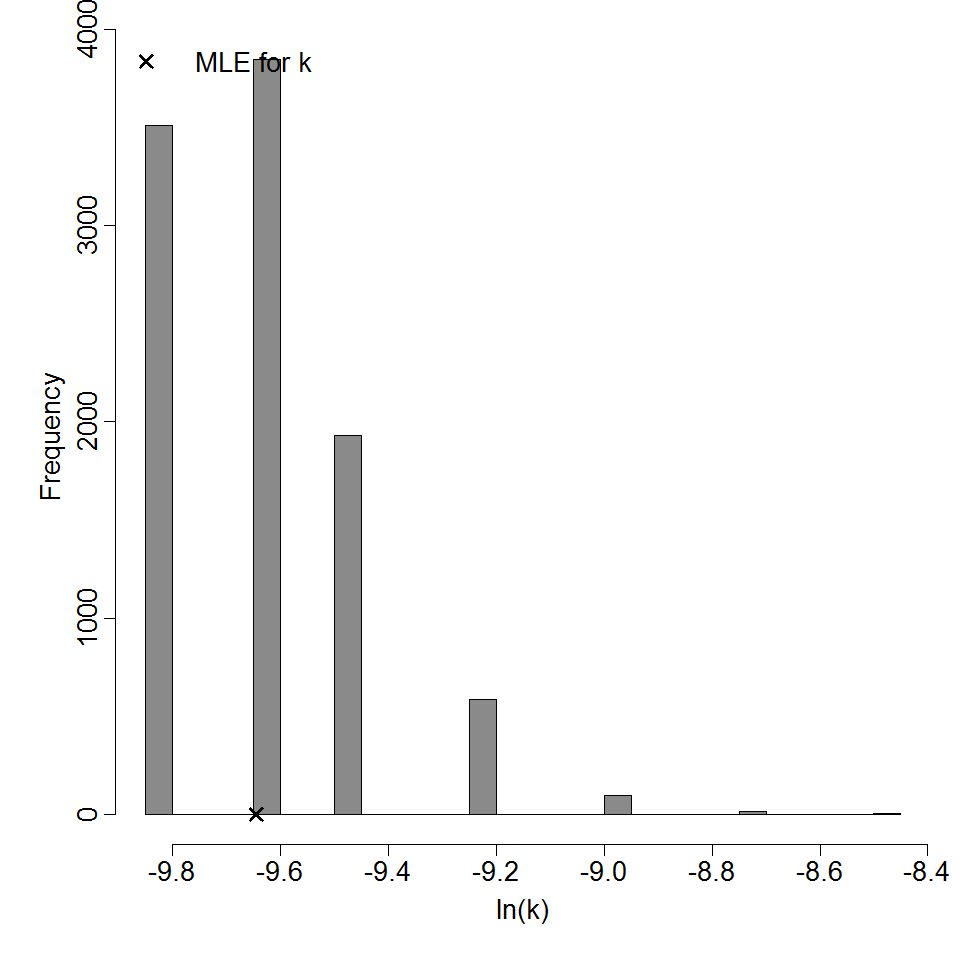
Parameter histogram for exponential model (uncertainty of the parameter)
Exponential model plot, with confidence bounds around optimized model