| Experiment ID |
247
|
|---|---|
| Pathogen | |
| Agent Strain |
strain 533
|
| Contains Preferred Model |
No
|
| Reference |
Meynell, G. G., & Meynell, E. W. (1958). The growth of micro-organisms in vivo with particular reference to the relation between dose and latent period. The Journal of Hygiene, 56(3). https://doi.org/10.1017/s0022172400037827 |
| Exposure Route |
intraperitoneal
|
| Response |
death
|
| Host type |
mice
|
|---|---|
| # of Doses |
11.00
|
| Dose Units |
CFU
|
| Μodel |
beta-Poisson
|
| a |
6.21E-02
|
| N50 |
3.46E+07
|
| LD50/ID50 |
3.46E+07
|
Description
|
||||||||||||||||||||||
|
||||||||||||||||||||||||||||||
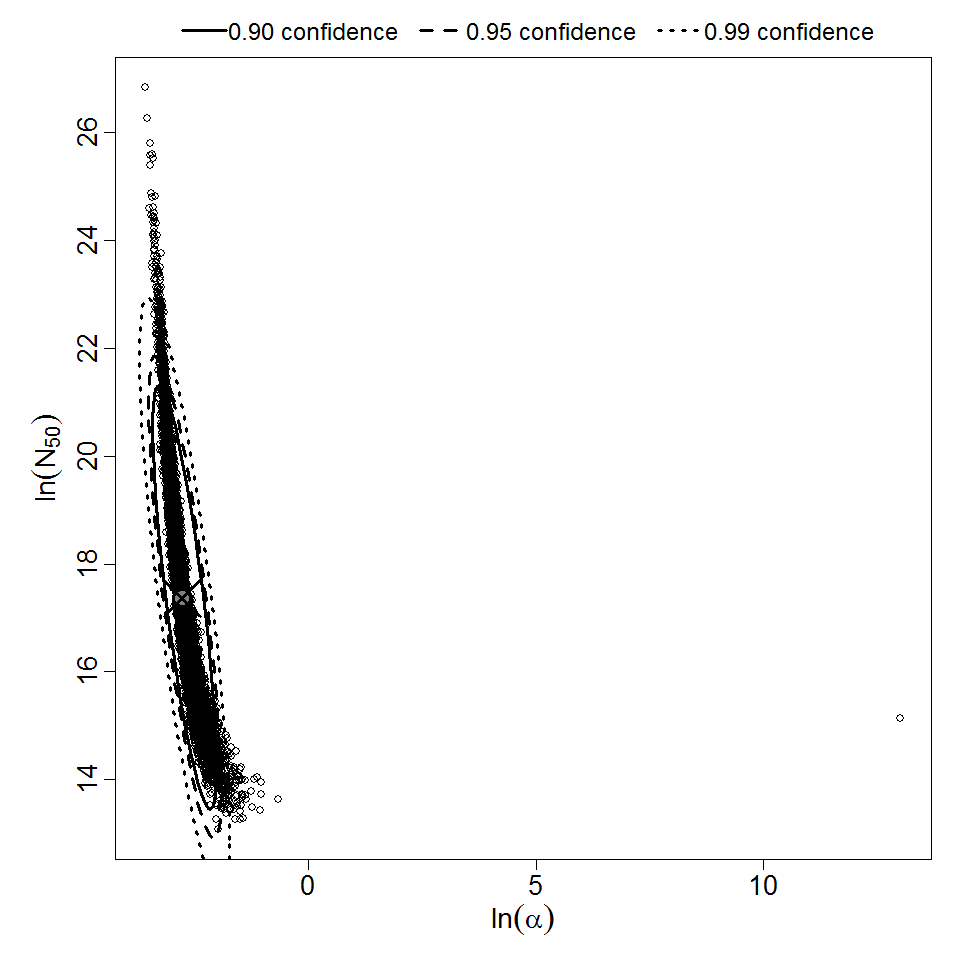
Parameter scatter plot for beta Poisson model ellipses signify the 0.9, 0.95 and 0.99 confidence of the parameters.
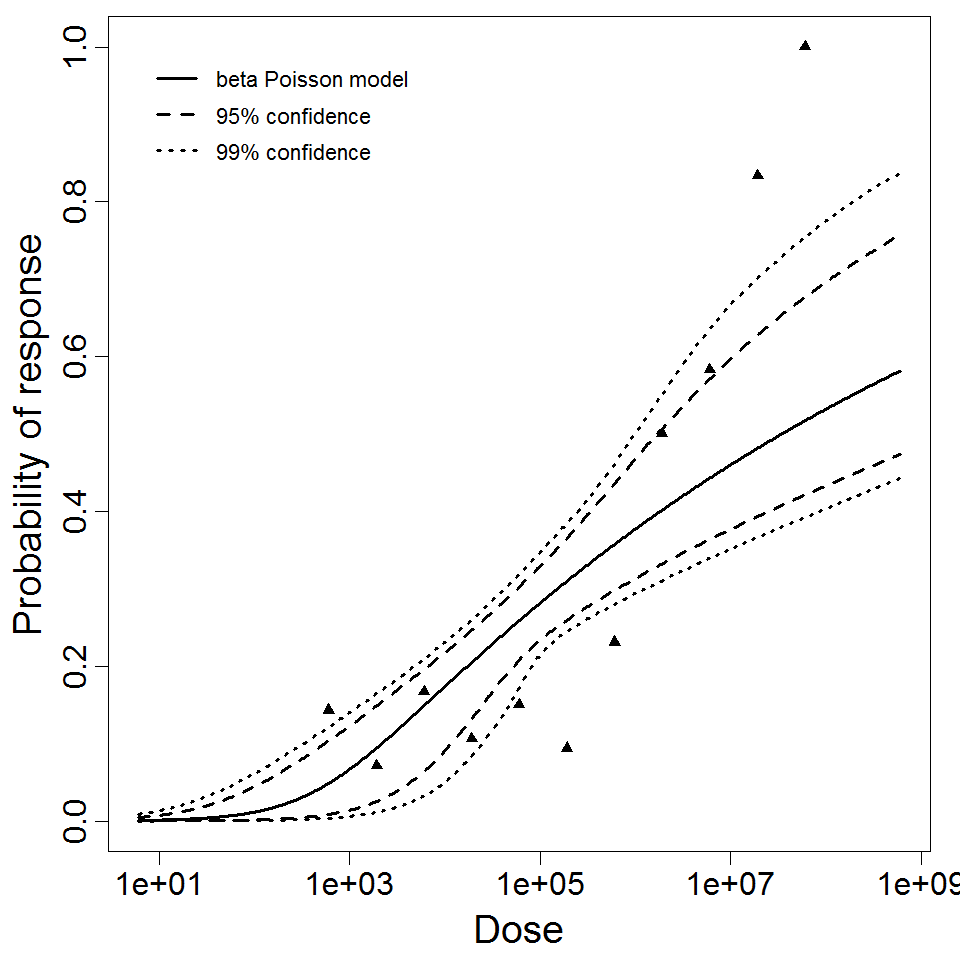
beta Poisson model plot, with confidence bounds around optimized model