| Experiment ID |
248
|
|---|---|
| Pathogen | |
| Agent Strain |
strain 533
|
| Contains Preferred Model |
No
|
| Reference |
Hornick, R. B., Music, S. I., Wenzel, R. ., Cash, R. ., Libonati, J. P., Snyder, M. J., & Woodward, T. E. (1971). The Broad Street pump revisited: response of volunteers to ingested cholera vibrios. Bulletin of the New York Academy of Medicine, 47, 10. Retrieved from https://www.ncbi.nlm.nih.gov/pmc/articles/PMC1749960/ |
| Exposure Route |
intraperitoneal
|
| Response |
death
|
| Host type |
mice
|
|---|---|
| # of Doses |
7.00
|
| Dose Units |
CFU
|
| Μodel |
beta-Poisson
|
| a |
1.08E-01
|
| N50 |
9.66E+06
|
| LD50/ID50 |
9.66E+06
|
Description
|
|
||||||||||||||||||||||
|
||||||||||||||||||||||||||||||

Parameter scatter plot for beta Poisson model ellipses signify the 0.9, 0.95 and 0.99 confidence of the parameters.
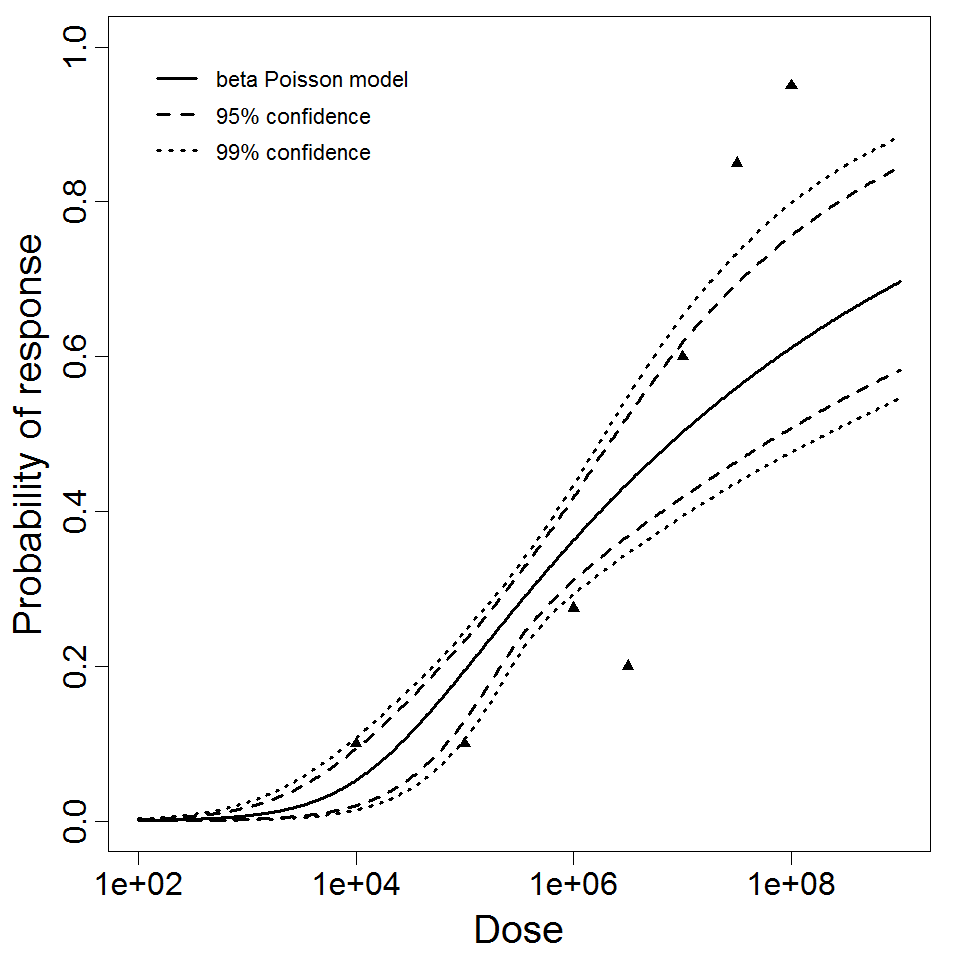
beta Poisson model plot, with confidence bounds around optimized model