| Experiment ID |
263
|
|---|---|
| Pathogen | |
| Agent Strain |
sub sp. Paratuberculosis IOI strain
|
| Contains Preferred Model |
No
|
| Reference |
Badenoch, P. R., Johnson, A. M., Christy, P. E., & Coster, D. J. (1990). Pathogenicity of Acanthamoeba and Corynebacterium in the Rat Cornea. Archives of Ophthalmology, 108, 1. Retrieved from https://jamanetwork.com/journals/jamaophthalmology/article-abstract/638228 |
| Exposure Route |
oral
|
| Response |
infection
|
| Host type |
cheviots
|
|---|---|
| # of Doses |
3.00
|
| Dose Units |
CFU
|
| Μodel |
beta-Poisson
|
| a |
5.79E-02
|
| N50 |
4.8E+02
|
| LD50/ID50 |
4.8E+02
|
Description
|
|
||||||||||||||||||||||
|
||||||||||||||||||||||||||||||
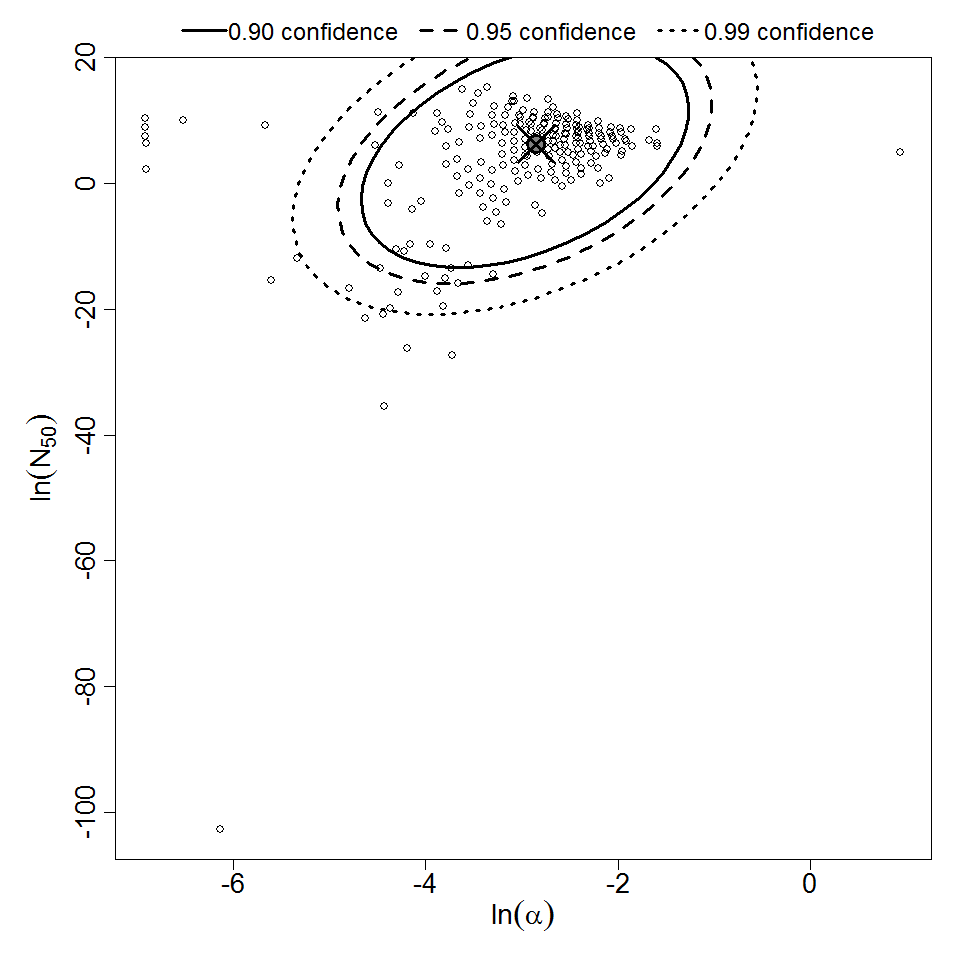
Parameter scatter plot for beta Poisson model ellipses signify the 0.9, 0.95 and 0.99 confidence of the parameters

beta Poisson model plot, with confidence bounds around optimized model