Pooled data (experiment no. 300 and 301) [1]
| Dose |
MORBIDITY |
NOT MORBIDITY |
Total |
| 13 |
2 |
4 |
6 |
| 25 |
1 |
3 |
4 |
| 66 |
2 |
0 |
2 |
| 83 |
2 |
0 |
2 |
| 99 |
2 |
0 |
2 |
| 126 |
6 |
1 |
7 |
| 182 |
7 |
0 |
7 |
| 1110 |
1 |
1 |
2 |
| 1260 |
17 |
1 |
18 |
| 1770 |
2 |
0 |
2 |
| 2290 |
2 |
0 |
2 |
| 2590 |
2 |
0 |
2 |
| 3170 |
2 |
0 |
2 |
| 5060 |
7 |
0 |
7 |
| 5520 |
2 |
0 |
2 |
| 5650 |
2 |
0 |
2 |
| 5670 |
1 |
0 |
1 |
| 7460 |
2 |
0 |
2 |
| 9200 |
2 |
0 |
2 |
| 10800 |
2 |
0 |
2 |
| 16800 |
2 |
0 |
2 |
| 41000 |
2 |
0 |
2 |
| 45500 |
3 |
0 |
3 |
| 53200 |
2 |
0 |
2 |
| 55200 |
2 |
0 |
2 |
| 132000 |
2 |
0 |
2 |
| 149000 |
2 |
0 |
2 |
|
Goodness of fit and model selection
| Model |
Deviance |
Δ |
Degrees
of freedom |
χ20.95,1
p-value |
χ20.95,m-k
p-value |
| Exponential |
42.2 |
30.5 |
26 |
3.84
3.41e-08 |
38.9
0.0235 |
| Beta Poisson |
11.7 |
25 |
37.7
0.989 |
| Beta-Poisson fits better than exponential; cannot reject good fit for beta-Poisson. |
|
Optimized parameters for the beta-Poisson model, from 10000 bootstrap iterations
| Parameter |
MLE estimate |
Percentiles |
| 0.5% |
2.5% |
5% |
95% |
97.5% |
99.5% |
| α |
7.77E-01 |
3.82E-01 |
4.41E-01 |
4.90E-01 |
4.24E+00 |
3.59E+03 |
3.25E+04 |
| N50 |
2.13E+01 |
5.70E+00 |
8.34E+00 |
1.01E+01 |
4.00E+01 |
4.16E+01 |
5.10E+01 |
|

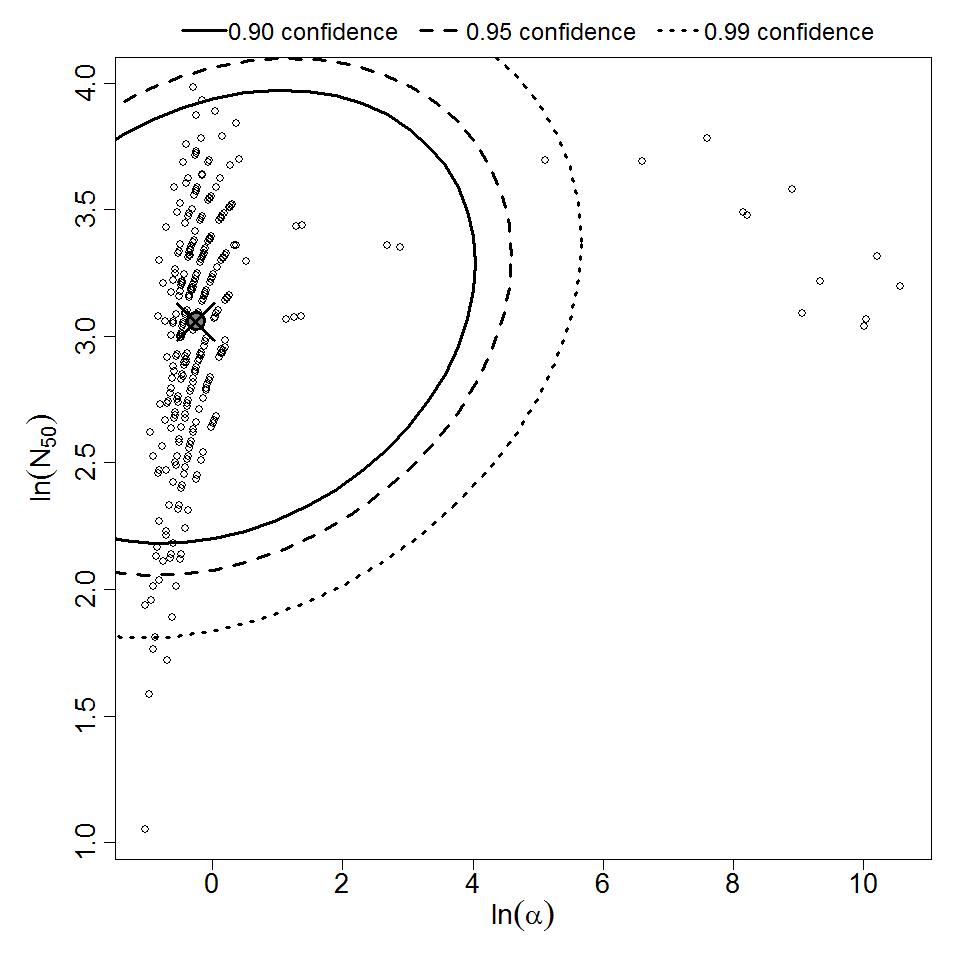
Parameter scatter plot for beta Poisson model ellipses signify the 0.9, 0.95 and 0.99 confidence of the parameters.

beta Poisson model plot, with confidence bounds around optimized model
References