| Experiment ID |
82
|
|---|---|
| Pathogen | |
| Agent Strain |
2a (strain 2457T)
|
| Contains Preferred Model |
No
|
| Reference |
DuPont, H. L., Hornick, R. B., Snyder, M. J., Libonati, J. P., Formal, S. B., & Gangarosa, E. J. (1972). Immunity in Shigellosis. I. Response of Man to Attenuated Strains of Shigella. Journal of Infectious Diseases, 125, 1. |
| Exposure Route |
oral (in milk)
|
| Response |
illness
|
| Host type |
human
|
||||||||||||||||||||
|---|---|---|---|---|---|---|---|---|---|---|---|---|---|---|---|---|---|---|---|---|---|
| # of Doses |
5.00
|
||||||||||||||||||||
| Dose Units |
CFU
|
||||||||||||||||||||
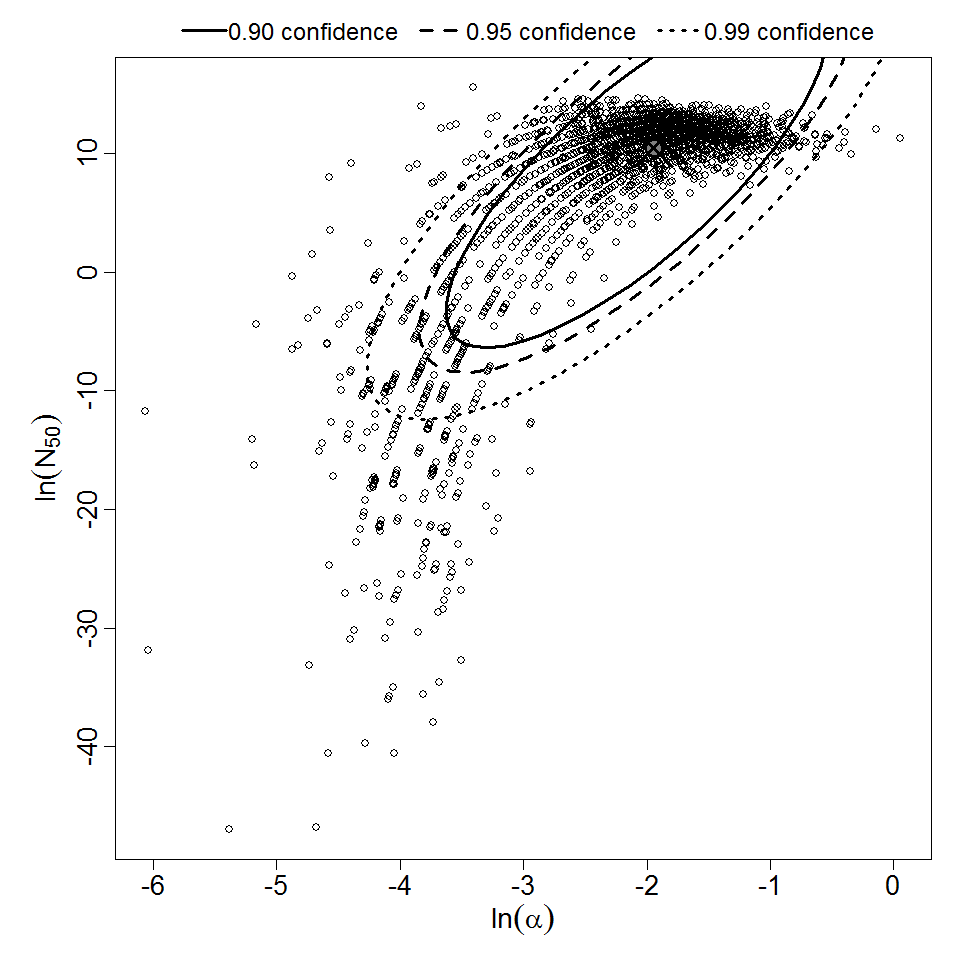
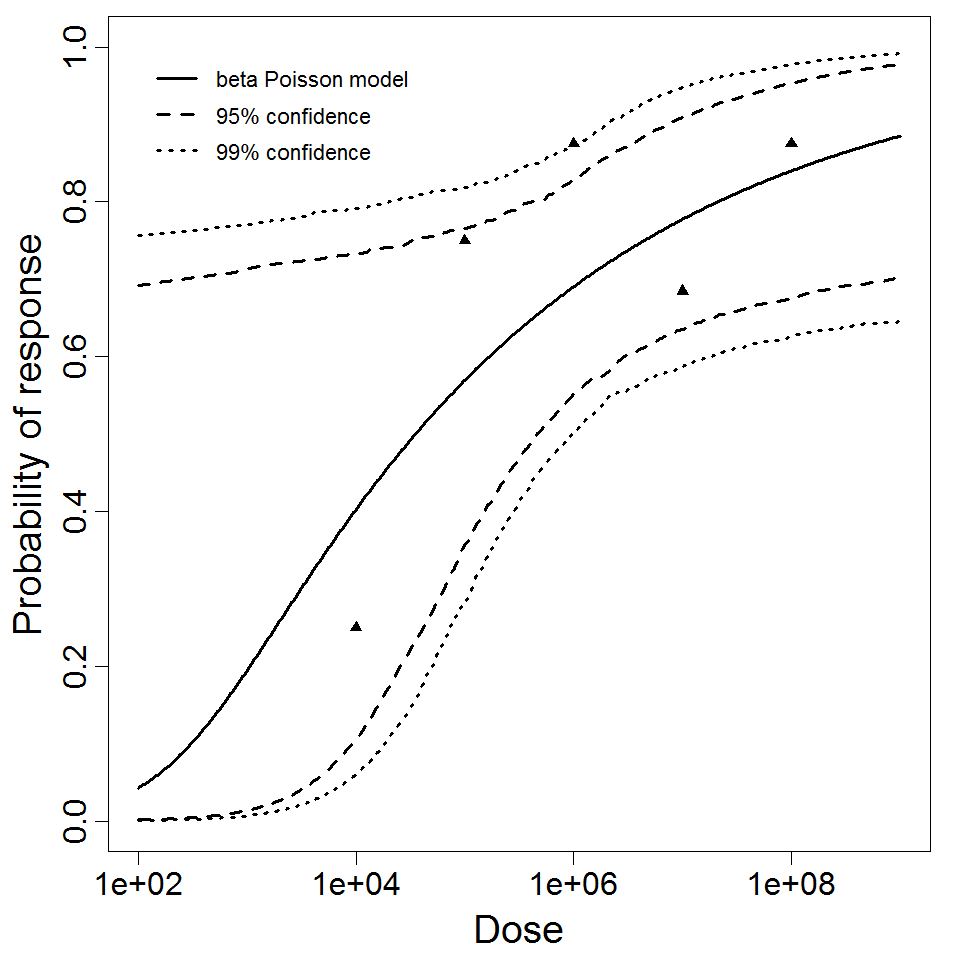
| Μodel |
beta-Poisson
|
||||||||||||||||||||
| a |
1.43E-01
|
||||||||||||||||||||
| N50 |
3.54E+04
|
||||||||||||||||||||
| LD50/ID50 |
3.54E+04
|
||||||||||||||||||||
| Experiment Dataset |
|
Description
|
| ||||||||||||||||||||||
| ||||||||||||||||||||||||||||||