| Experiment ID |
68
|
|---|---|
| Pathogen | |
| Agent Strain |
OSU (ATCC VR892)
|
| Contains Preferred Model |
No
|
| Reference |
Payment, P. ., & Morin, E. . (1990). Minimal infective dose of the OSU strain of porcine rotavirus. Archives of Virology, 112, 3-4. |
| Exposure Route |
intragastric
|
| Response |
infection
|
| Host type |
pig
|
|---|---|
| # of Doses |
10.00
|
| Dose Units |
particles
|
| Μodel |
exponential
|
| k |
1.73E-02
|
| LD50/ID50 |
4E+01
|
Description
|
||||||||||||||||||||||
|
||||||||||||||||||||||||||||||||||||||
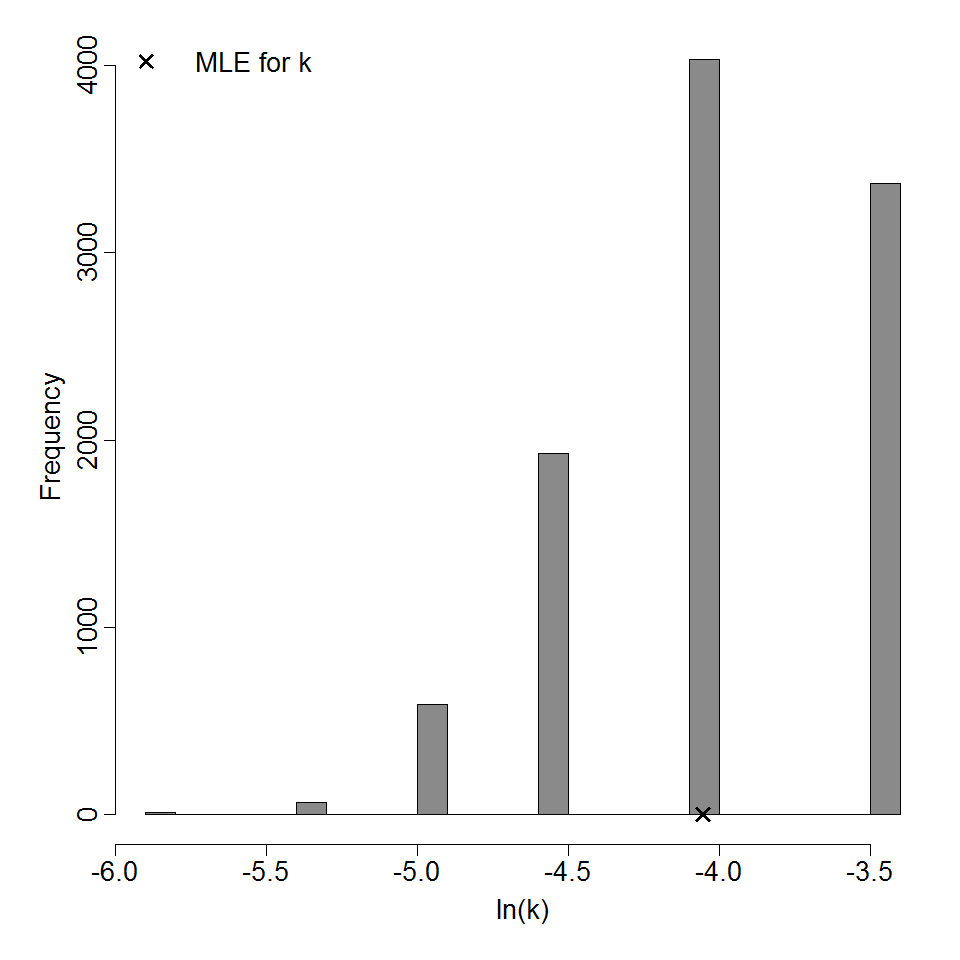
Parameter histogram for exponential model (uncertainty of the parameter)
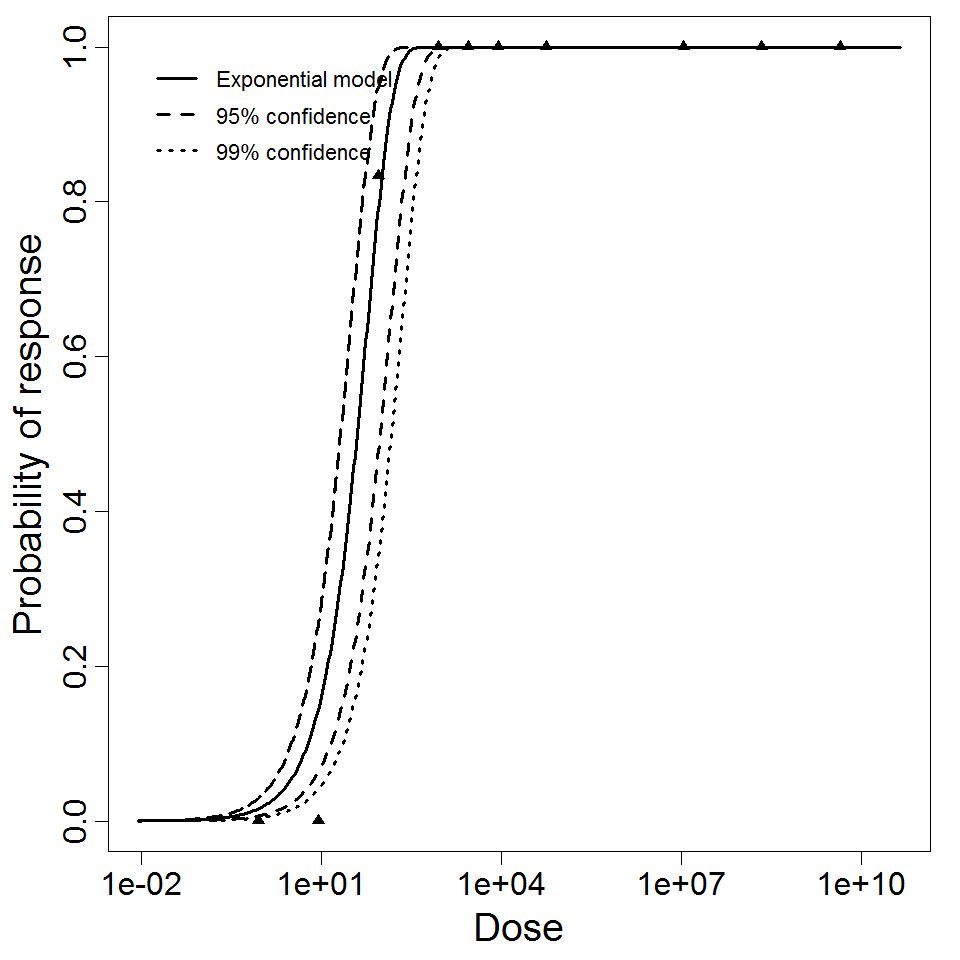
Exponential model plot, with confidence bounds around optimized model